
Human Footprint and Vegetation Trend: 1950 to 2021
Summary of trends in human footprint and vegetation, from 1950 to 2021, in Tolko's Northern Operating Area.

Human footprint and vegetation trend highlights from 2000 to 2021:
Human Footprint
Human Footprint
Forestry Footprint
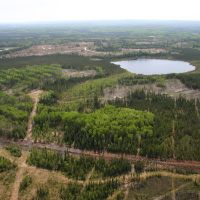
dji_fly_20230207_144410_13_1679415555132_photo_square.JPG)
Vegetation Types
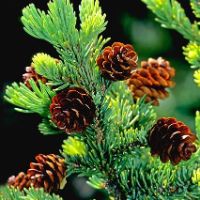
White Spruce
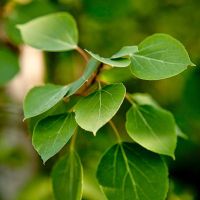
Deciduous

Introduction
“Coarse-filter” monitoring of human footprint and native vegetation complements “fine-filter” monitoring of species by providing detailed information on habitat changes, a main driver of species changes.
- Tracking and managing changes in land use and human footprint is important to minimize impacts to biodiversity[1].
- In addition, land base monitoring of major vegetation types provides information on what types might be disproportionately affected by human footprint, and where management efforts may need to be focused.
- Due to the remoteness of Tolko’s Northern Operating Area, industrial activities were slow to develop prior to 1980. But human development activities have been growing at an increasingly rapid pace since that time, particularly in the early 2000s.
In this section, trend (from 1950 to 2021) in human footprint and native vegetation is summarized for Tolko’s Northern Operating Area.
Results
Trend in Human Footprint
The change in human footprint between 2000 and 2021 in the Northern Operating Area was:
total human footprint
Forestry footprint
Forestry Footprint, Net
energy footprint
Highlights
- In Tolko’s Northern Operating Area, human footprint increased by 4.1 percentage points over the 50-year time frame between 1950 and 2000 (from 0.1% to 4.2%). More area was disturbed between 2000 and 2021, with human footprint increasing by 5.8 percentage points, from 4.2% to 10.0%.
- Forestry footprint was negligible in 1950, and increased by 4.7 percentage points, from 2.5% to 7.2%, between 2000 and 2021 (not accounting for forest recovery). From 2000 to 2021, forestry footprint increased at a fairly constant rate of 0.22% of the region per year.
- Accounting for recovery of harvest areas lowers the actual 2021 forestry footprint of 7.2% to a net footprint of 5.3%. This implies an average recovery of 26.4% for forestry footprint between 2000 and 2021, which amounts to 1.9% of the entire region.
- Energy footprint increased slowly between 1950 and 2000, showed a big jump from 2000 to 2001, then increased quite slowly through 2006. Energy footprint has declined slightly since then, as this footprint is replaced by other footprint types.
- The remaining footprint types increased by only small amounts between 1950 and 2021.
View as Graph
View as Table
Trend in Human Footprint. The trend in the per cent (%) area of total human footprint and by human footprint category in the Northern Operating Area between 1950 and 2021. Trend data are available for 1950 and 1985, and missing 2002–2003. The trend table summarizes the most recent changes from 2000–2021. Total human footprint includes all categories other than Forestry, Net. Hover over categories in the legend (graph view) to highlight the corresponding trend line. Hover over trend lines to see data values. Error bars represent 95% confidence intervals.
Results
Trend in Vegetation Types
The change in vegetation type between 2000 and 2021 in the Northern Operating Area was:
white spruce
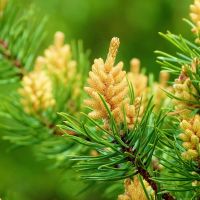
pine
deciduous
mixedwood
Highlights
- White Spruce was the vegetation type most impacted by human footprint; it had the largest percentage point drop from 1950 to 2021, with most of the decrease happening between 2000 and 2021 (2.0 percentage points decrease from 6.7% to 4.7%). Being uncommon in the Northern Operating Area, the proportional area of White Spruce that has been affected by human footprint each year is high: 1.4% per year from 2000 to 2021. These numbers do not account for forestry recovery.
- Mixedwood, which is rare in the Northern Operating area, was the second most impacted vegetation type, with a 1.6 percentage point drop from 1950 to 2021, and 1.0 percentage points from 2000 to 2021. Human footprint has been affecting 0.87% of mixedwood per year. Hardwood mills were built in the region in the late 1990s and 2000s, which could account for some of this change.
- Deciduous—the dominant upland stand type in the region—was only converted to human footprint at the rate of 0.29% per year since 2000.
- Pine stands, which cover the smallest area in the region, had a similarly modest rate of decrease.
- Very small areas of lowland stand types were impacted by human footprint between 1950 and 2021.
View as Graph
View as Table
Trend in Vegetation Types. The trend in the per cent (%) area of broad stand types over time in the Northern Operating Area between 1950 and 2021. Trend data are available for 1950 and 1985, and missing 2002–2003. The trend table summarizes the most recent changes over 2000–2021. Hover over categories in the legend (graph view) to highlight the corresponding trend line. Hover over trend lines to see data values. Error bars represent 95% confidence intervals.
Trend in Old Forest Stands >120 Years
The change in old forest (>120 years), by vegetation type, between 2000 and 2021 in the Northern Operating Area was:
white spruce
pine
deciduous
mixedwood
Highlights
- Using a 120-year cutoff for old forest, there was substantial ongoing increase in old deciduous and Black Spruce stands, reflecting the aging of a late-1800s cohort.
- White Spruce and mixedwood also saw some 120+ year recruitment, but forest harvesting led to a net slow decline in the area of old stands in these two forest types.
View as Graph
View as Table
Trend in Vegetation Types—Old (>120 years) Forest. The trend in the per cent (%) area of broad stand types over time in the Northern Operating Area between 2000 and 2021, for forest >120 years old. Trend data are missing for 2002–2003. The trend table summarizes the changes over 2000–2021. Hover over categories in the legend (graph view) to highlight the corresponding trend line. Hover over trend lines to see data values. Error bars represent 95% confidence intervals.
References
Shackleford, N., R.J. Standish, W. Ripple, and B.M. Starzomski. 2017. Threats to biodiversity from cumulative human impacts in one of North America’s last wildlife frontiers. Conservation Biology 32(3): 672-684. https://doi.org/10.1111/cobi.13036
