Effects of Human Footprint on Habitat Suitability
Summary of the impacts of industrial sector footprints on habitat suitability for species across six taxonomic groups in Tolko's Nouthern Operating Area.


Habitat suitability declined for 59% of species where human footprint occurred.
- Habitat suitability was lower within human footprint compared to the native vegetation it replaced for ~59% of species across six taxonomic groups.
- Lichens and mosses were the most negatively affected by human footprint, while other species groups, particularly birds and vascular plants, exhibited a broader range of responses to different sectors.
- Forestry resulted in stronger negative effects on species reliant on old, upland forest stands.
- All sectors increase habitat suitability for species associated with open and/or disturbed habitat.
- Sectors such as energy and transportation have reduced impact at the regional scale because of their smaller footprint.
Introduction
As part of their commitment to environmental stewardship, industries seek to understand how their activities impact species and their habitats.
Identifying the species most affected by a particular industrial sector can aid in land-use planning and, if necessary, creating mitigation strategies. However, with multiple industries operating within the same land base, disentangling the specific impacts of each industry on different species can be challenging.
Tolko harvests coniferous tree species in its Northern Operating Area, where it shares tenure with other forestry companies and industrial developments such as oil and gas.
In this section we summarize the local and regional impacts of different types of human footprint (i.e., energy, forestry, urban/industrial, transportation) on the habitat suitability of species in the Northern Operating Area.
Examples of how species are impacted by different types of human footprint

Forest harvesting can increase the availability of berries—an important food source for bears.
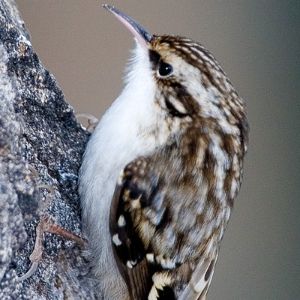
Forest harvesting decreases habitat suitability for old-forest species, like the Brown Creeper.

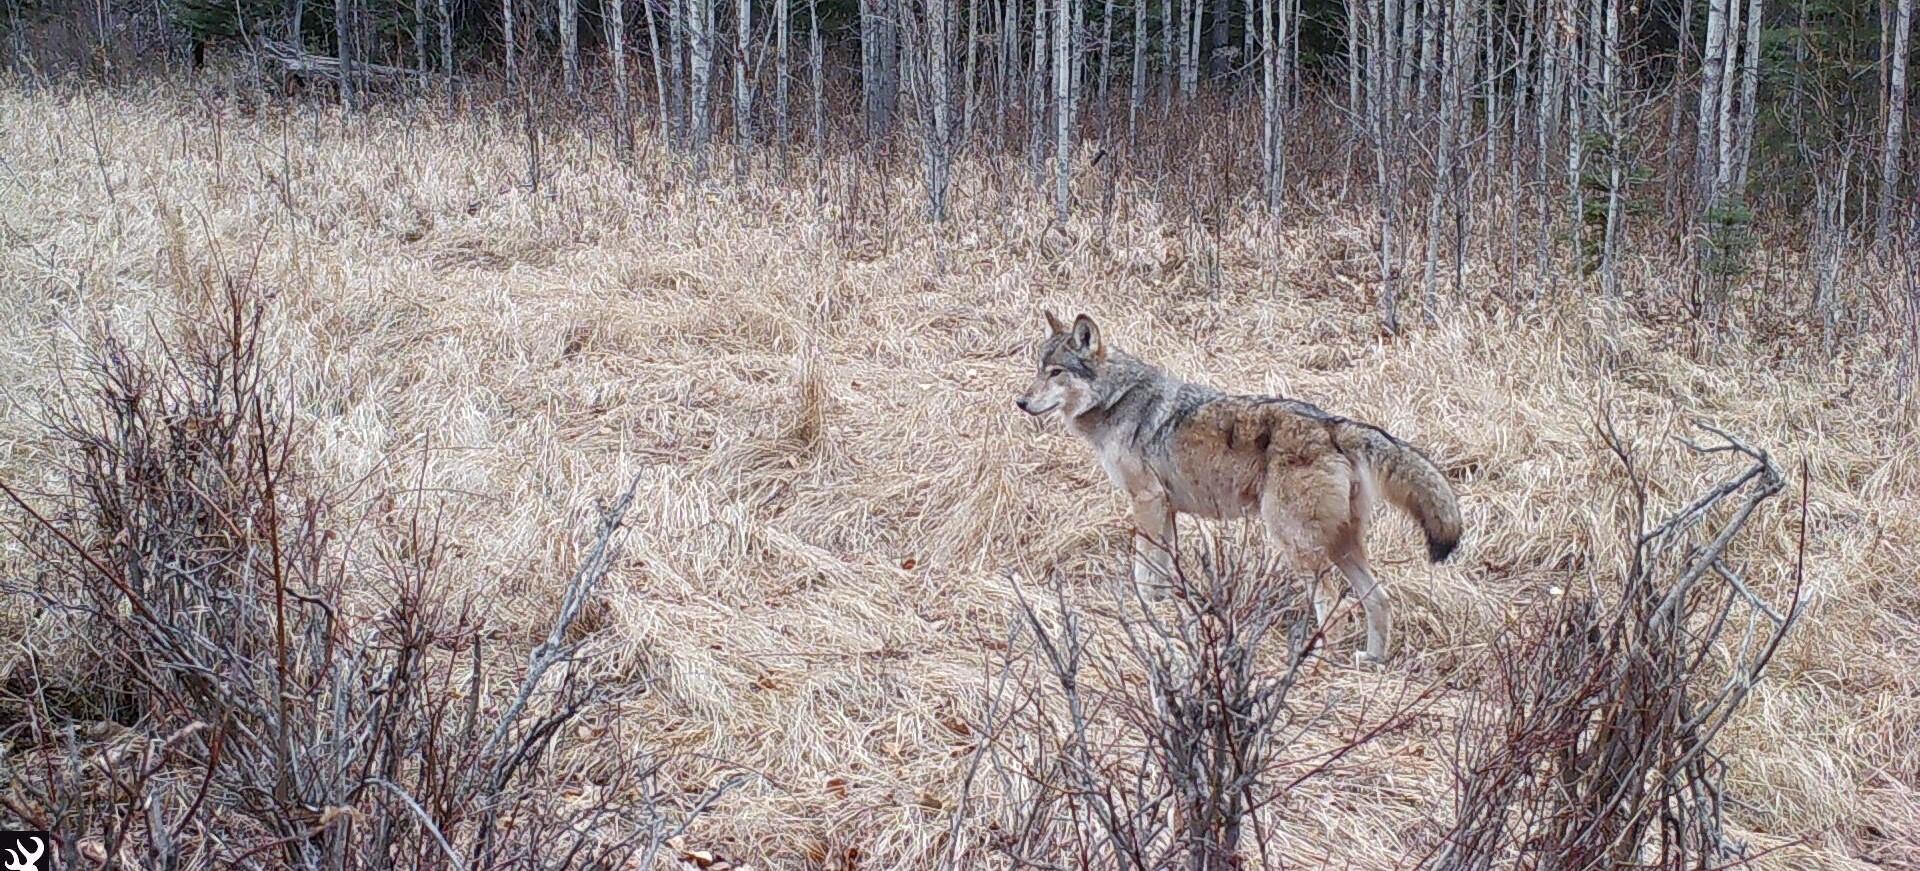
Linear footprint, such as seismic lines and roads, increases the movement of predators such as wolves.
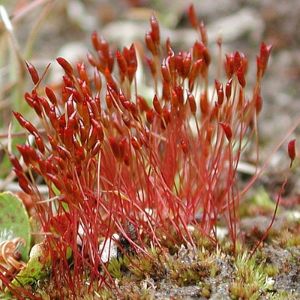
Human footprint decreases habitat suitability for most mosses. Purple moss (Ceratodon purpureus) is one of only a few moss species that is commonly found in different types of human footprint.
Results
Impacts of Human Footprint on Biodiversity
The ABMI assessed the impacts of human footprint from four different sectors—energy, forestry, transportation, and urban/industrial—on six taxonomic groups in Tolko’s Northern Operating Area. Impacts are assessed within each specific footprint, and at the regional scale. Because agriculture footprint is so small and localized in this landscape, its impacts are not discussed.
The ABMI reports on two aspects of these “sector effects”:
- Local Sector Effects: reflects how habitat suitability changes in areas directly impacted by industrial activities.
- Regional Sector Effects: indicate how habitat suitability across a region is changed by the footprint of each sector. This incorporates the area of the footprint, the native habitats impacted where the footprint occurs, and the species’ response to a particular footprint. The calculation incorporates the entire land base of the Northern Operating Area, large tracts of which have minimal human footprint.
Click on a tab below to view sector effects results for each taxonomic group:
Birds
Impacts of Human Footprint on Birds
The graphs below show the distribution of bird species' responses to different sectors at the local scale (i.e., within the footprint) and at the regional scale. Examples of how different bird species respond to all sector effects combined at the regional scale include:
Golden-crowned Kinglet (-16%)
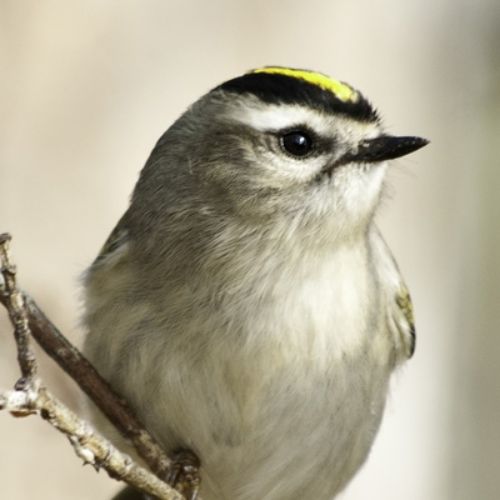
Golden-crowned Kinglet is associated with mature/old coniferous forests and is negatively affected by human footprint. Habitat suitability is predicted to decrease for this species in the Northern Operating Area.
Northern Waterthrush (no change)

Northern Waterthrush is associated with shrubby riparian areas, wooded bogs, and swamps with deciduous shrub cover. Habitat suitability for this species is not predicted to change.
Northern Flicker (+11%)

Northern Flicker prefers moderately open forest, and will often nest at the edge of harvested stands. Habitat suitability is predicted to increase for this species.
Local Sector Effects. Predicted changes (%) to bird species’ habitat suitability within each human footprint type compared to the habitat it replaced in the Northern Operating Area. Sector effects values <0% indicate lower suitability in that type of footprint than in the original habitat; values >0% indicate a positive response.
Regional Sector Effects. Total regional effects (%) on habitat suitability by industrial sector for bird species in the Northern Operating Area. Total effects values <0% indicate lower habitat suitability at the regional scale due to a particular sector; values >0% indicate an increase in habitat suitability.
Graph Interpretation
Local Sector Effects
At the local scale, in areas where footprint occurs, birds show a mixed response to the four industrial sectors in Tolko’s Northern Operating Area.
- Within forestry footprint, habitat suitability is improved for 57% of bird species. Some species, such as Lincoln’s Sparrow, are associated with early seral forests and do well in young harvest areas, while others live in open habitats like fields and wet areas. The bird species that respond most negatively are all associated with mature/old forest.
- Within energy footprint, habitat suitability decreased for 52% of bird species.
- Urban/industrial and transportation footprint types reduce the habitat suitability for the majority of bird species (90% and 77%, respectively) compared to the native habitat they replace, and provide unsuitable habitat for a few species (-100% change). But there are some habitat generalists that thrive in these footprint types.
- In each footprint type there are several bird species that have very large per cent increases (>100%). These species are rare in native habitats but do well in footprint.
Regional Sector Effects
At the regional scale, overall human footprint improves habitat suitability for 55% of bird species in Tolko’s Northern Operating Area.
- Forestry footprint has the greatest effects on regional habitat suitability for birds compared to other sectors in Tolko’s Northern Operating Area because it occupies the greatest area; effects ranged from a 17% loss in habitat (Western Tanager) to a 19% gain in habitat (Alder Flycatcher).
- The limited extent of the other sectors reduces their effects on the regional habitat suitability for birds, ranging from a 2% loss to a 4% gain in habitat.
- Forestry has somewhat stronger negative effects (>10%) on habitat suitability for several bird species that are associated with the older upland forests where this sector operates (e.g., Golden-crowned Kinglet at -16% and Brown Creeper at -15%).
- The remaining sectors are spread across all habitat types, preventing disproportionate negative effects on any species.
- Forestry footprint leads to large increases in the regional habitat suitability for several species of birds, including Alder Flycatcher (+19%) and Ruffed Grouse (+13%). These species either prefer recent harvest areas, or prefer open habitats and ground disturbances.
Sector Effects by Taxonomic Group
To view sector effect results for individual bird species, use the search bar to find a species or select your species of interest from the dropdown menu. Once you click on a species in the dropdown menu, the sector effects graphs will appear in the space below.
Mammals
Impacts of Human Footprint on Mammals
The graphs below show the distribution of mammal species' responses to different sectors at the local scale (i.e., within the footprint) and at the regional scale. Examples of how different mammal species respond to all sector effects combined at the regional scale include:
Marten (-3%)
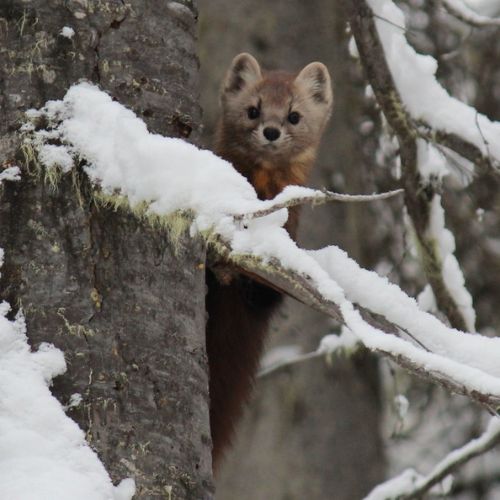
Marten prefer mature/old coniferous forests and respond negatively to forest harvest and human footprint. Habitat suitability is predicted to decrease for this species in the Northern Operating Area.
Red Squirrel (no change)

Red Squirrel is a common species that can use various vegetation and human footprint types, so long as there are enough conifer cones to support individual territories. Habitat suitability for this species is not predicted to change.
Snowshoe Hare (+3%)
_Lepus%20americanus_smaller.jpg)
Snowshoe Hare can be found in all forested and dense shrubby habitats, and responds positively to forest harvest. Habitat suitability is predicted to increase for this species.
Local Sector Effects. Predicted changes (%) to mammal species’ habitat suitability within each human footprint type compared to the habitat it replaced in the Northern Operating Area. Sector effects values <0% indicate lower suitability in that type of footprint than in the original habitat; values >0% indicate a positive response.
Regional Sector Effects. Total regional effects (%) on habitat suitability by industrial sector for mammal species in the Northern Operating Area. Total effects values <0% indicate lower habitat suitability at the regional scale due to a particular sector; values >0% indicate an increase in habitat suitability.
Graph Interpretation
Local Sector Effects
At the local scale, in areas where human footprint occurs, habitat suitability is reduced for the majority of mammal species in Tolko’s Northern Operating Area.
- Forestry footprint has a smaller effect on habitat suitability for mammals compared to other industrial sectors, and improves habitat suitability for 7 of 11 mammal species.
- Habitat is reduced for most mammal species in energy (6 species), urban/industrial (8 species) and transportation footprints (8 species).
- The species that lose habitat in all sector footprints are Marten and Fisher, which typically live in older forests, and Black Bear, which is often found in forests and along forest edges.
- Habitat suitability is improved in all footprint types for the Coyote, which is a generalist species, as well as for species that prefer early seral and shrubby habitats, including Canada Lynx, Snowshoe Hare, and Moose.
Regional Sector Effects
Most large mammals that the ABMI monitors with wildlife cameras are habitat generalists or use early seral habitat, and show relatively little response to scattered human footprint at the regional scale.
- Energy footprint has the greatest effects on mammals compared to other sectors in the Northern Operating Area, with changes in habitat suitability ranging from a 6% loss to a 5% gain in habitat. The largest response across footprint types was for Wolverine, with suitable habitat declining by 6% due to energy footprint.
- Forestry footprint has the next-strongest effects on mammal habitat suitability at the regional scale, with changes in habitat suitability ranging from a 2% loss to a 4% gain in habitat.
- The regional effects on habitat suitability of urban/industrial and transportation footprints are very small.
Sector Effects by Taxonomic Group
To view sector effect results for individual mammal species, use the search bar to find a species or select your species of interest from the dropdown menu. Once you click on a species in the dropdown menu, the sector effects graphs will appear in the space below.
Soil Mites
Impacts of Human Footprint on Soil Mites
The graphs below show the distribution of soil mite species' responses to different sectors at the local scale (i.e., within the footprint) and at the regional scale. Examples of how different soil mite species respond to all sector effects combined at the regional scale include:
Eremaeus translamellatus (-8%)
Eremaeus translamellatus is associated with mature/old pine forests and is negatively affected by human footprint. Habitat suitability is predicted to decrease for this species in the Northern Operating Area.
Eniochthonius crosbyi (no change)

Eniochthonius crosbyi is strongly associated with Black Spruce forests; habitat suitability for this species is not predicted to change.
Oribatodes mirabilis (+7%)

Oribatodes mirabilis is a common species that is strongly associated with harvested forest stands; habitat suitability is predicted to increase for this species.
Local Sector Effects. Predicted changes (%) to soil mite species’ habitat suitability within each human footprint type compared to the habitat it replaced in the Northern Operating Area. Sector effects values <0% indicate lower suitability in that type of footprint than in the original habitat; values >0% indicate a positive response.
Regional Sector Effects. Total regional effects (%) on habitat suitability by industrial sector for soil mite species in the Northern Operating Area. Total effects values <0% indicate lower habitat suitability at the regional scale due to a particular sector; values >0% indicate an increase in habitat suitability.
Graph Interpretation
Local Sector Effects
At the local scale, in areas where human footprint occurs, habitat suitability is reduced for 59% of soil mite species in Tolko’s Northern Operating Area.
- Forestry footprint decreases habitat suitability for 56% of soil mite species. Some, such as Neogymnobates luteus, are strongly associated with old coniferous forest stands.
- Habitat suitability is also reduced for the majority of soil mite species in energy (62%) and transportation footprints (67%).
- Urban/industrial footprint reduces habitat suitability for all but six soil mite species. This footprint compacts soil and removes important habitat elements for soil mites, such as layers of leaf litter.
Regional Sector Effects
At the regional scale, overall human footprint lowers habitat suitability for 59% of soil mite species in Tolko’s Northern Operating Area.
- Forestry footprint results in the greatest changes in habitat suitability at the regional scale compared to other sectors because it occupies the greatest area; effects ranged from a 13% loss in habitat (Neogymnobates luteus) to a gain of 8% (Punctoribates palustris).
- Some of the strongest negative effects of forestry footprint are found in species, such as Neogymnobates luteus (-13%) and Oribatella yukonensis (-7%), that are associated with the older upland forests where this sector operates.
- The limited extent of the other sectors reduces their effects on the regional habitat suitability for soil mites, with responses falling generally within -2% to 6% of intact reference conditions.
Sector Effects by Taxonomic Group
To view sector effect results for individual soil mite species, use the search bar to find a species or select your species of interest from the dropdown menu. Once you click on a species in the dropdown menu, the sector effects graphs will appear in the space below.
Vascular Plants
Impacts of Human Footprint on Vascular Plants
The graphs below show the distribution of vascular plant species' responses to different sectors at the local scale (i.e., within the footprint) and at the regional scale. Examples of how different vascular plant species respond to all sector effects combined at the regional scale include:
Tall Larkspur (-12%)

Tall Larkspur is associated with older forest stands, with habitat suitability increasing with stand age, and responds negatively to human footprint. Habitat suitability is predicted to decrease for this species in the Northern Operating Area.
Red and White Baneberry (no change)

Red and White Baneberry is a common species that responds positively to both forest age and forest harvest. Habitat suitability for this species is not predicted to change.
Rough Cinquefoil (+21%)

Rough Cinquefoil is a pioneer species that readily germinates in disturbances but is uncommon in established communities. Habitat suitability is predicted to increase for this species.
Local Sector Effects. Predicted changes (%) to vascular plant species’ habitat suitability within each human footprint type compared to the habitat it replaced in the Northern Operating Area. Sector effects values <0% indicate lower suitability in that type of footprint than in the original habitat; values >0% indicate a positive response.
Regional Sector Effects. Total regional effects (%) on habitat suitability by industrial sector for vascular plant species in the Northern Operating Area. Total effects values <0% indicate lower habitat suitability at the regional scale due to a particular sector; values >0% indicate an increase in habitat suitability.
Graph Interpretation
Local Sector Effects
At the local scale, in areas where human footprint occurs, habitat suitability is reduced for 52% of the vascular plant species in Tolko’s Northern Operating Area.
- Habitat suitability is improved for more than half of vascular plant species in forestry (51%), energy (58%) and transportation (53%) footprints.
- Urban/industrial footprint has the largest overall effect, with habitat suitability decreasing for 80% of vascular plant species.
- In each footprint type there are several vascular plant species that have very large percent increases (>100%) in habitat suitability. Many of these species are pioneer species—species that colonize new or recently disturbed environments—that do well in human footprint.
Regional Sector Effects
At the regional scale, overall human footprint lowers habitat suitability for 52% of vascular plant species in Tolko’s Northern Operating Area.
- Forestry footprint has the greatest effects on regional habitat suitability for vascular plants compared to other sectors in the Northern Operating Area because it occupies the greatest area; effects range from a 17% loss in habitat (Heart-Leaved Twayblade) to a 38% gain (Hay Sedge).
- The limited extent of the other sectors reduces their effects on the regional habitat suitability for vascular plants, with responses generally falling within -3% to 6% of intact reference conditions. A few species showed increases outside of this range under both energy and transportation footprints.
- Forestry has somewhat stronger negative effects (>10%) on the regional habitat suitability for several vascular plant species (e.g., Heart-leaved Twayblade at -17% and Tall Larkspur at -12%). These species are associated with the older upland forests where this sector operates.
- Forestry produces large increases in the regional habitat suitability for several species of vascular plants, such as Hay Sedge (38%). These species either prefer recent harvest areas, or prefer open habitats and ground disturbances.
Sector Effects by Taxonomic Group
To view sector effect results for individual vascular plant species, use the search bar to find a species or select your species of interest from the dropdown menu. Once you click on a species in the dropdown menu, the sector effects graphs will appear in the space.
Mosses
Impacts of Human Footprint on Mosses
The graphs below show the distribution of moss species' responses to different sectors at the local scale (i.e., within the footprint) and at the regional scale. Examples of how different moss species respond to all sector effects combined at the regional scale include:
Copper Wire Moss (-24%)

Copper Wire Moss is associated with old White Spruce and Pine forest stands, with habitat suitability increasing with age, and is negatively affected by human footprint. Habitat suitability is predicted to decrease for this species in the Northern Operating Area.
Lesser Tamarisk-moss (no change)

Lesser Tamarisk-moss is a common species that is found in a variety of stand ages and types. Habitat suitability for this species is not predicted to change.
Golden Thread-moss (+3%)

Golden Thread-moss is associated with young forest stands and disturbed habitats. Habitat suitability is predicted to increase for this species.
Local Scale Sector Effects. Predicted changes (%) to moss species’ habitat suitability within each human footprint type compared to the habitat it replaced in the Northern Operating Area. Sector effects values <0% indicate lower suitability in that type of footprint than in the original habitat; values >0% indicate a positive response.
Regional Sector Effects. Total regional effects (%) on habitat suitability by industrial sector for moss species in the Northern Operating Area. Total effects values <0% indicate lower habitat suitability at the regional scale due to a particular sector; values >0% indicate an increase in habitat suitability.
Graph Interpretation
Local Sector Effects
At the local scale, in areas where human footprint occurs, habitat suitability is reduced for 72% of the moss species in Tolko’s Northern Operating Area.
- In forestry footprint, habitat suitability is reduced for 69% of moss species. Many mosses are associated with habitat elements that are most abundant in old forests, such as downed wood and moist, shaded habitat.
- Habitat suitability decreases for 75% and 80% of moss species in energy and transportation footprints, respectively.
- Urban/industrial footprint reduces habitat suitability for 96% of moss species. Many species simply cannot live in this footprint type.
- One species, Bonfire Moss, shows a strong increase in habitat suitability in all sectors. Bonfire Moss is not strongly associated with forest stands, and responds positively to some human footprint types.
Regional Sector Effects
At the regional scale, overall human footprint lowers habitat suitability for 72% of moss species in Tolko’s Northern Operating Area.
- Forestry footprint has the greatest effects on regional habitat suitability for mosses compared to other sectors in the Northern Operating Area because it occupies the greatest area; effects range from a 35% loss in habitat (Cushion Moss) to a 26% gain (Bonfire Moss).
- The limited extent of the other sectors reduces their effects on the regional habitat suitability for mosses, with most responses falling within ±2% of intact reference conditions.
- Forestry has somewhat stronger negative effects on the regional habitat suitability for several moss species—for example, Cushion Moss, at -35%—that are associated with the older upland forests where this sector operates.
Sector Effects by Taxonomic Group
To view sector effect results for individual moss species, use the search bar to find a species or select your species of interest from the dropdown menu. Once you click on a species in the dropdown menu, the sector effects graphs will appear in the space below.
Lichens
Impacts of Human Footprint on Lichens
The graphs below show the distribution of lichen species' responses to different sectors at the local scale (i.e., within the footprint) and at the regional scale. Examples of how different lichen species respond to all sector effects combined at the regional scale include:
Pebbled Pixie-cup (-5%)

Pebbled Pixie-cup is associated with old coniferous stands, with habitat suitability increasing with stand age, and is negatively affected by human footprint. Habitat suitability is predicted to decrease for this species in the Northern Operating Area.
Boreal Oakmoss Lichen (no change)
Boreal Oakmoss Lichen is one of the most common lichen species in the forested areas of Alberta, and can be found in various forest stand types and wetlands. Habitat suitability for this species is not predicted to change.
Poplar Needles (+2%)

Poplar Needles can be found in a wide variety of habitats, and responds positively to forest harvest. Habitat suitability is predicted to increase for this species.
Local Sector Effects. Predicted changes (%) to lichen species’ habitat suitability within each human footprint type compared to the habitat it replaced in the Northern Operating Area. Sector effects values <0% indicate lower suitability in that type of footprint than in the original habitat; values >0% indicate a positive response.
Regional Sector Effects. Total regional effects (%) on habitat suitability by industrial sector for lichen species in the Northern Operating Area. Total effects values <0% indicate lower habitat suitability at the regional scale due to a particular sector; values >0% indicate an increase in habitat suitability.
Graph Interpretation
Local Sector Effects
At the local scale, in areas where human footprint occurs, habitat suitability is reduced for 78% of lichen species in Tolko’s Northern Operating Area.
- Habitat suitability is reduced for the majority of lichen species in forestry (77%), energy (94%), and transportation footprints (94%). Lichens are sensitive to changes in microclimate (local temperature, humidity) and amount of ambient rain and dust, all of which can be affected by human footprint.
- Urban/industrial footprint reduces habitat suitability for all lichen species by at least 43%. Many species simply cannot live in this footprint type.
- Habitat suitability increases in human footprint for a few lichen species, mainly in forest harvest areas.
Regional Sector Effects
At the regional scale, overall human footprint lowers habitat suitability for 78% of lichen species in Tolko’s Northern Operating Area.
- Forestry footprint has the greatest effects on regional habitat suitability for lichens compared to other sectors in the Northern Operating Area because it occupies the greatest area; effects range from a 24% loss in habitat (Angel’s Hair) to a 10% gain (Peltigera didactyla grp.).
- The limited extent of the other sectors reduces their effects on the regional habitat suitability for lichens, with all responses falling within ±2% of intact reference conditions.
- Several lichen species are associated with the older upland forests where forestry operates. Habitat suitability for these species is predicted to decrease by at least 15% at the regional scale due to forestry footprint. For example, Angel's Hair is expected to decline by 24% and Milky-skin Centipede Lichen by 15%.
Sector Effects by Taxonomic Group
To view sector effect results for individual lichen species, use the search bar to find a species or select your species of interest from the dropdown menu. Once you click on a species in the dropdown menu, the sector effects graphs will appear in the space below.
