Status of Linear Features
Summary of the status of linear human footprint (circa 2021) in Tolko's Northern Operating Area.

Status of linear footprint in Tolko's Northern Operating Area:
Total density
Seismic lines
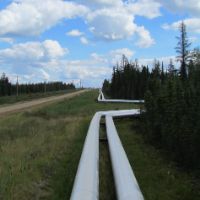
Pipelines
Roads
Introduction
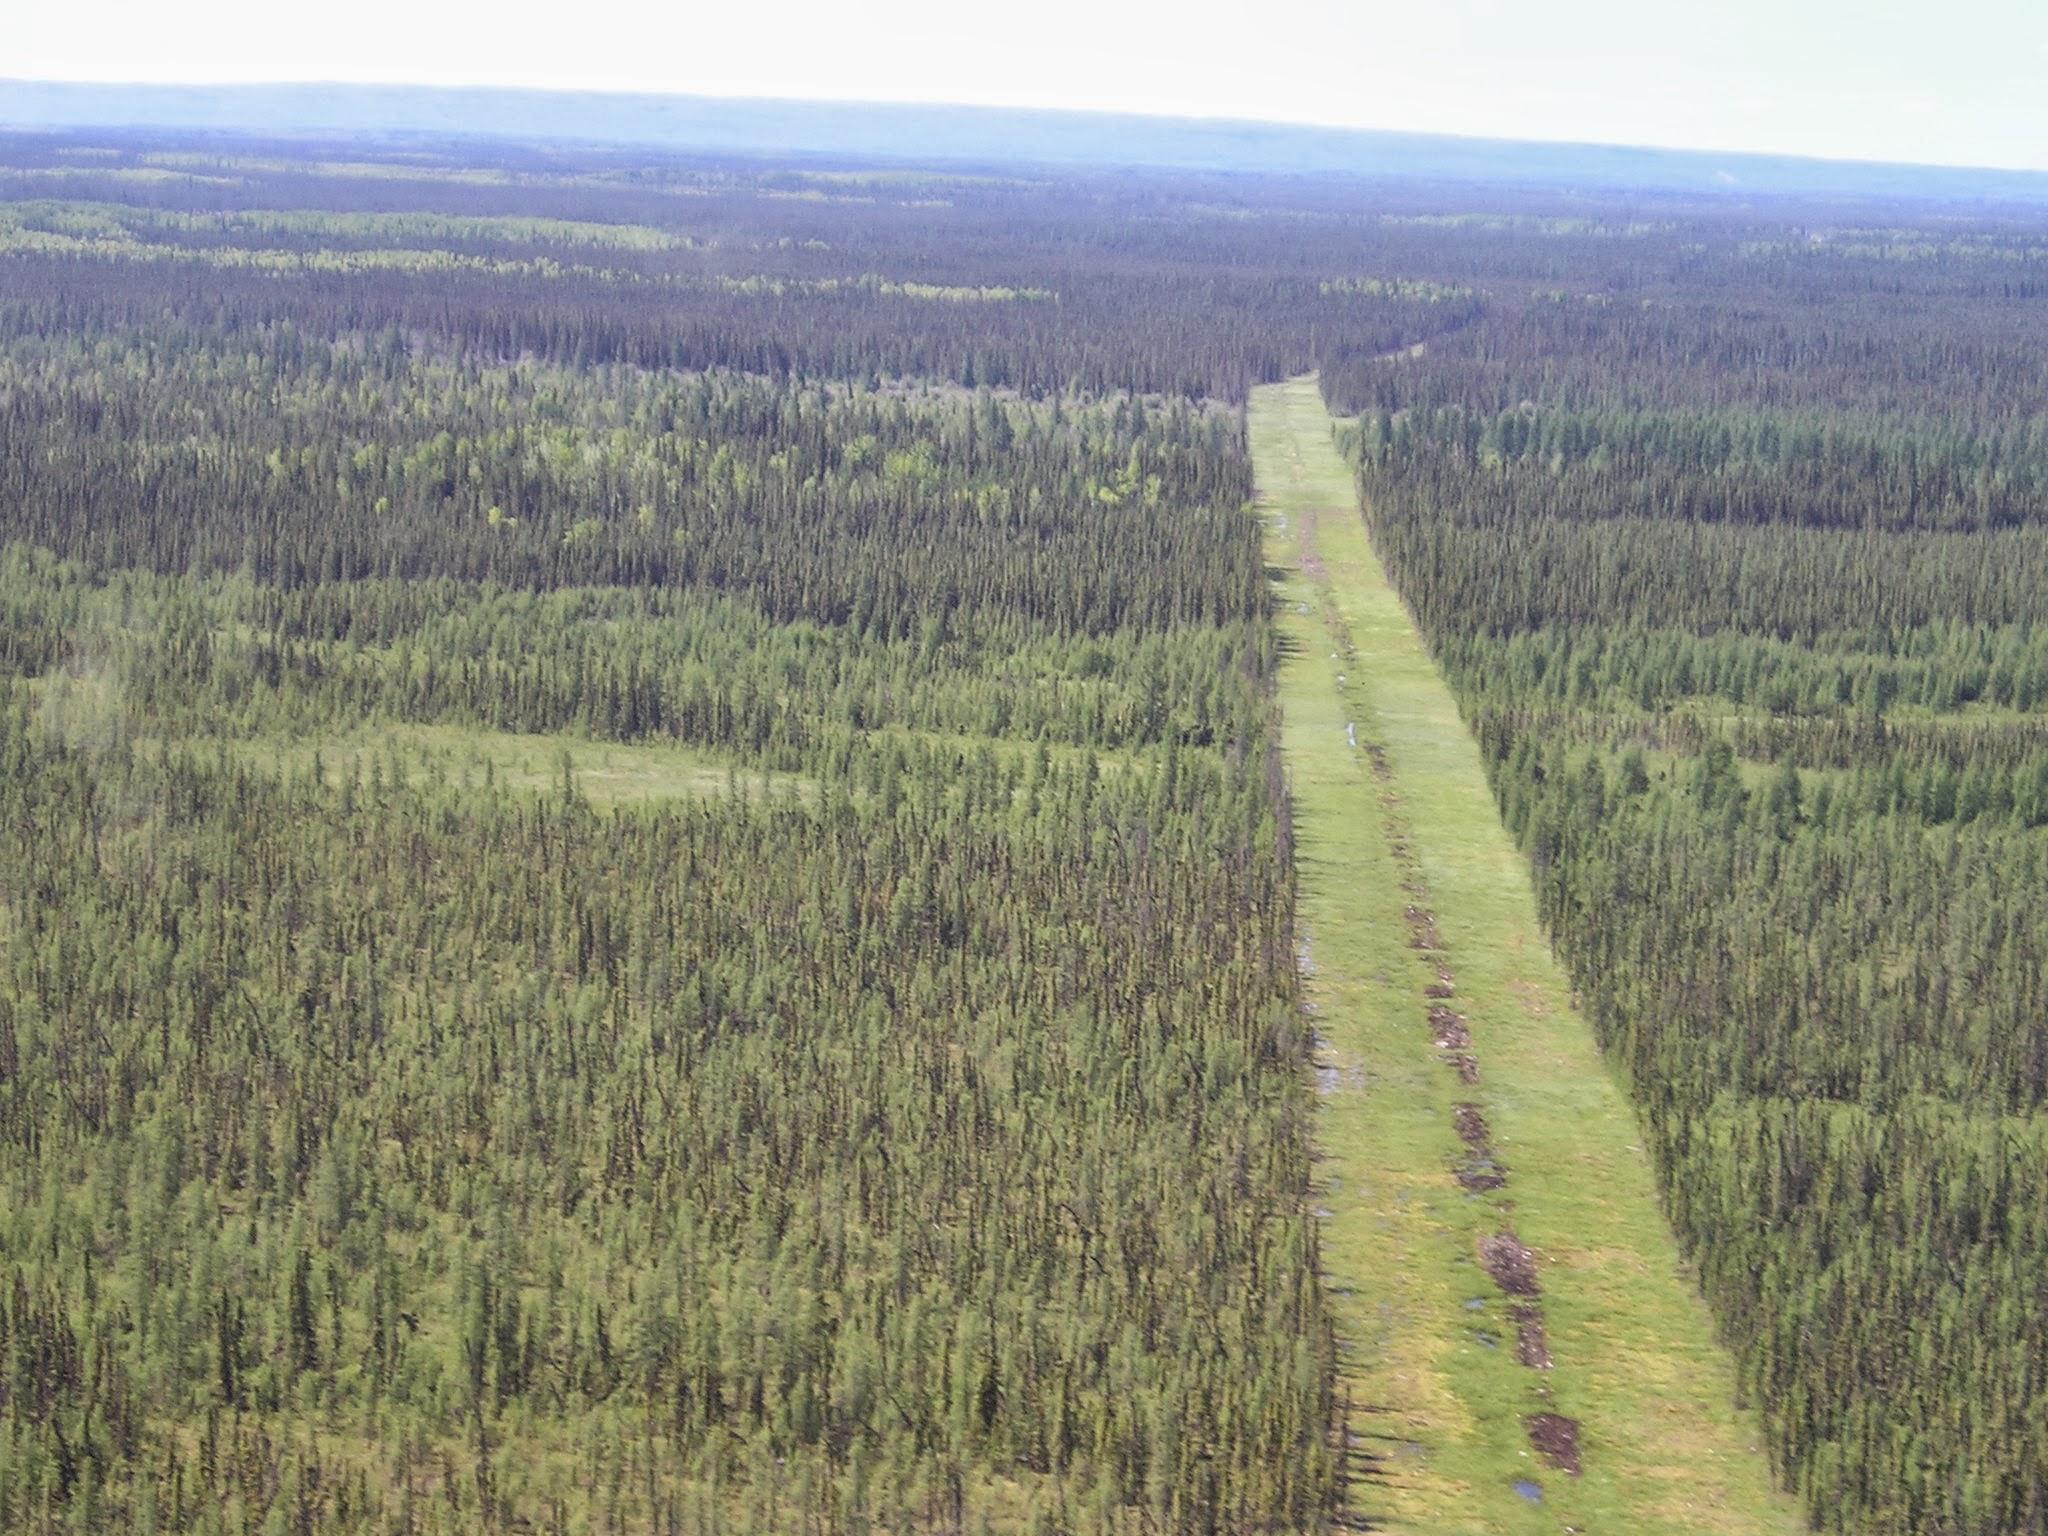
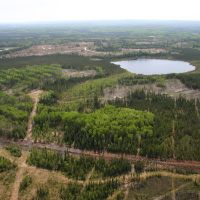
There is a large network of linear footprint dissecting Tolko’s Northern Operating Area.
While linear footprint occupies a small direct area of the land base, it can have disproportionate impacts on both environmental conditions and wildlife habitat relative to its size[1].
Linear footprint creates a large amount of forest edge, which changes the environment (e.g., sunlight, temperature, wind) close to these boundaries compared to forest interior conditions, reducing the area of interior native habitat (see Section 2.6).
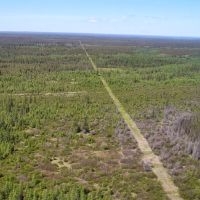
Impacts to different components of biodiversity vary among species, with some "winners" and some "losers”[2]. Seismic lines, which are by far the most common linear feature type in the boreal forest, can have the following impacts:
- affect movement across the landscape—for example, faster movement by large predators such as Gray Wolves[3], dispersal by vascular plants including non-native species[4], and range expansion of some species like White-tailed Deer[5];
- improve habitat suitability for some species and decrease suitability for others[6];
- alter predator-prey dynamics, most notably between Woodland Caribou, alternate prey (e.g., Moose, deer), and Gray Wolves; and
- alter community composition (e.g., soil mites)[6].
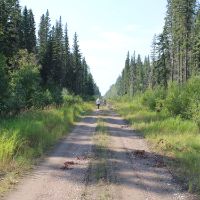
Understanding the distribution of linear features, including line type, is important in supporting cumulative effects management in Tolko’s Northern Operating Area.
Seismic lines alter wildlife behaviour, and affect environmental conditions in the surrounding habitat.

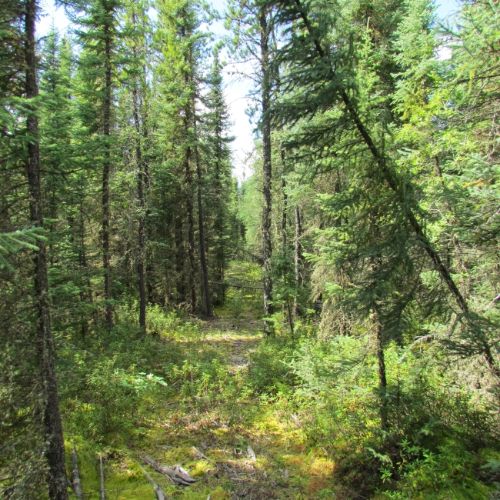
Dispersal of non-native vascular plants, such as Alsike Clover, increases along linear features.
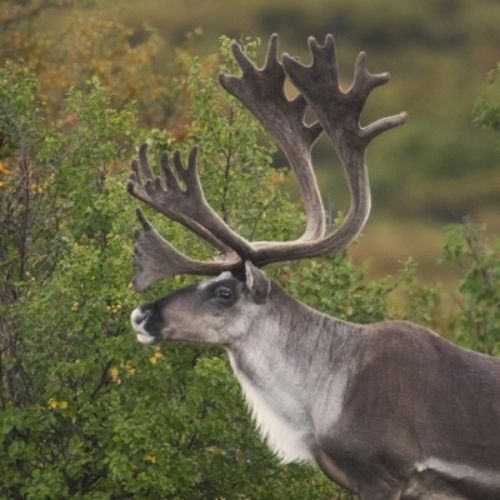
Woodland Caribou populations are declining, in part because of the high density of linear features.
Results
Status of Linear Footprint
Highlights
- Conventional seismic lines were the predominant line type in the Northern Operating Area, representing 88% of linear features in the region, with a density of 2.9 km/km2.
- Pipelines (0.2 km/km2) and roads (0.2 km/km2) were next, each representing 6% of linear features.
- Transmission lines and railway lines had very low densities in the Northern Operating Area.
- Some linear features, such as low-impact seismic lines, are not currently included in the linear feature analysis.
View as Graph
View as Table
Density of Linear Features. Density (km/km2) of linear features (as of 2021), overall and broken down by linear feature type in the Northern Operating Area. Hover over the bar or legend (in graph view) to view the density of specific feature types.
References
Brook, B.W., N.S. Sodhi, and C.J.A. Bradshaw. 2008. Synergies among extinction drivers under global change. Trends in Ecology and Evolution 23(8):453-460.
Fisher, J.T. and A.C. Burton. 2018. Wildlife winners and losers in an oil sands landscape. Frontiers in Ecology and the Environment 16(6):323-328. doi.org/10.1002/fee.1807
Dickie, M.R., R. Serrouya, R.S. McNay, and S. Boutin. 2017. Faster and farther: wolf movement on linear features and implications for hunting behaviour. Journal of Applied Ecology 54(1):253-263.
Bayne, E., H. Lankau, and J. Tigner. 2011. Ecologically-based criteria to assess the impact and recovery of seismic lines: The importance of width, regeneration, and seismic density. Report No. 192. Edmonton, AB. 98 pp.
Dawe, K.L., E.M. Bayne, and S. Boutin. 2014. Influence of climate and human land use on the distribution of white-tailed deer (Odocoileus virginianus) in the western boreal forest. Canadian Journal of Zoology 92(4):353-363.
Meehan, M.L., Z. Son, L.M. Lumley, T.P. Cobb, and H. Proctor. 2019. Soil mites as bioindicators of disturbance in the boreal forest in northern Alberta, Canada: Testing taxonomic sufficiency at multiple taxonomic levels. Ecological Indicators 102(2019):349-365. doi.org/10.1016/j.ecolind.2019.02.043
