Detailed Land Base Change from 2010 to 2021
Summary of the effects of land base change, including fire, human footprint, and forest aging, on vegetation types in Tolko's Southern Operating Area.

Per cent of native vegetation disturbed
- The vegetation types most affected by the combined impacts of fire and human activity were White Spruce (20%) and mixedwood (22%).
- Fire on its own contributed 4–6% of the disturbance in upland forests.
- Forestry removed 13–25% of old forest in the four upland stand types, with the highest rates in mixedwood, while fire removed an additional 7–9%.
- Large areas of deciduous and mixedwood stands aged beyond 120 years, with small areas reaching that age in White Spruce and pine stands.
Introduction
Land base attribution uses the ABMI’s wall-to-wall vegetation and human footprint mapping for 2010 and 2021 to summarize changes in native vegetation.
This analysis adds to the preceding summaries of native vegetation trend (Section 2.2) in three ways:
- Along with human footprint, this analysis also shows the changes in native vegetation due to fire, the dominant natural disturbance in both boreal and foothill ecosystems. In these forests, fires—along with other natural disturbances like insect outbreaks and disease—create a mosaic of stands of different ages from young forests to forests more than 150 years old. This mosaic of ages helps maintain biodiversity across northwestern Alberta.
- Land base attribution analyzes changes in each native vegetation type and assigns them to specific types of human footprint, summarized here as forestry versus non-forestry footprints.
- Land base attribution includes the effects of aging in undisturbed native stands or forestry areas. For vegetation types with an age criterion, like old stands, this allows for the tracking of both recruitment and losses from fire and human footprint. This provides a clearer understanding of why old forests are changing and whether these changes will continue.
In this section, we summarize how vegetation types in Tolko’s Southern Operating Area were affected by fire, along with forestry footprint and other human footprint, from 2010 to 2021.
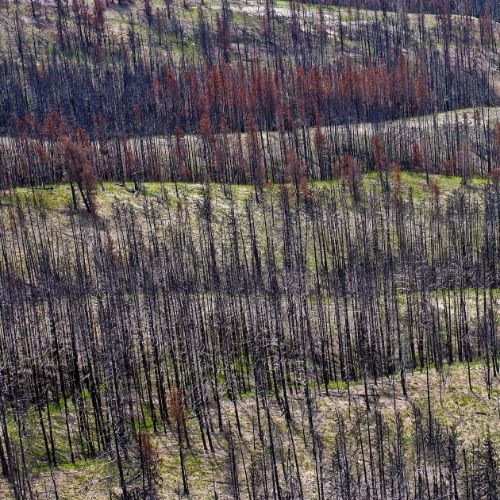
Wildfire is the dominant type of natural disturbance impacting native vegetation in northwestern Alberta.
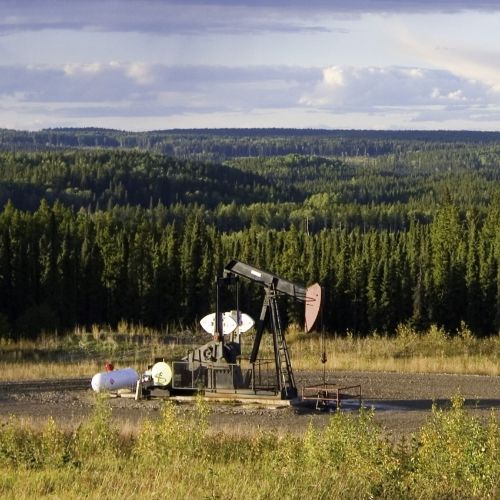
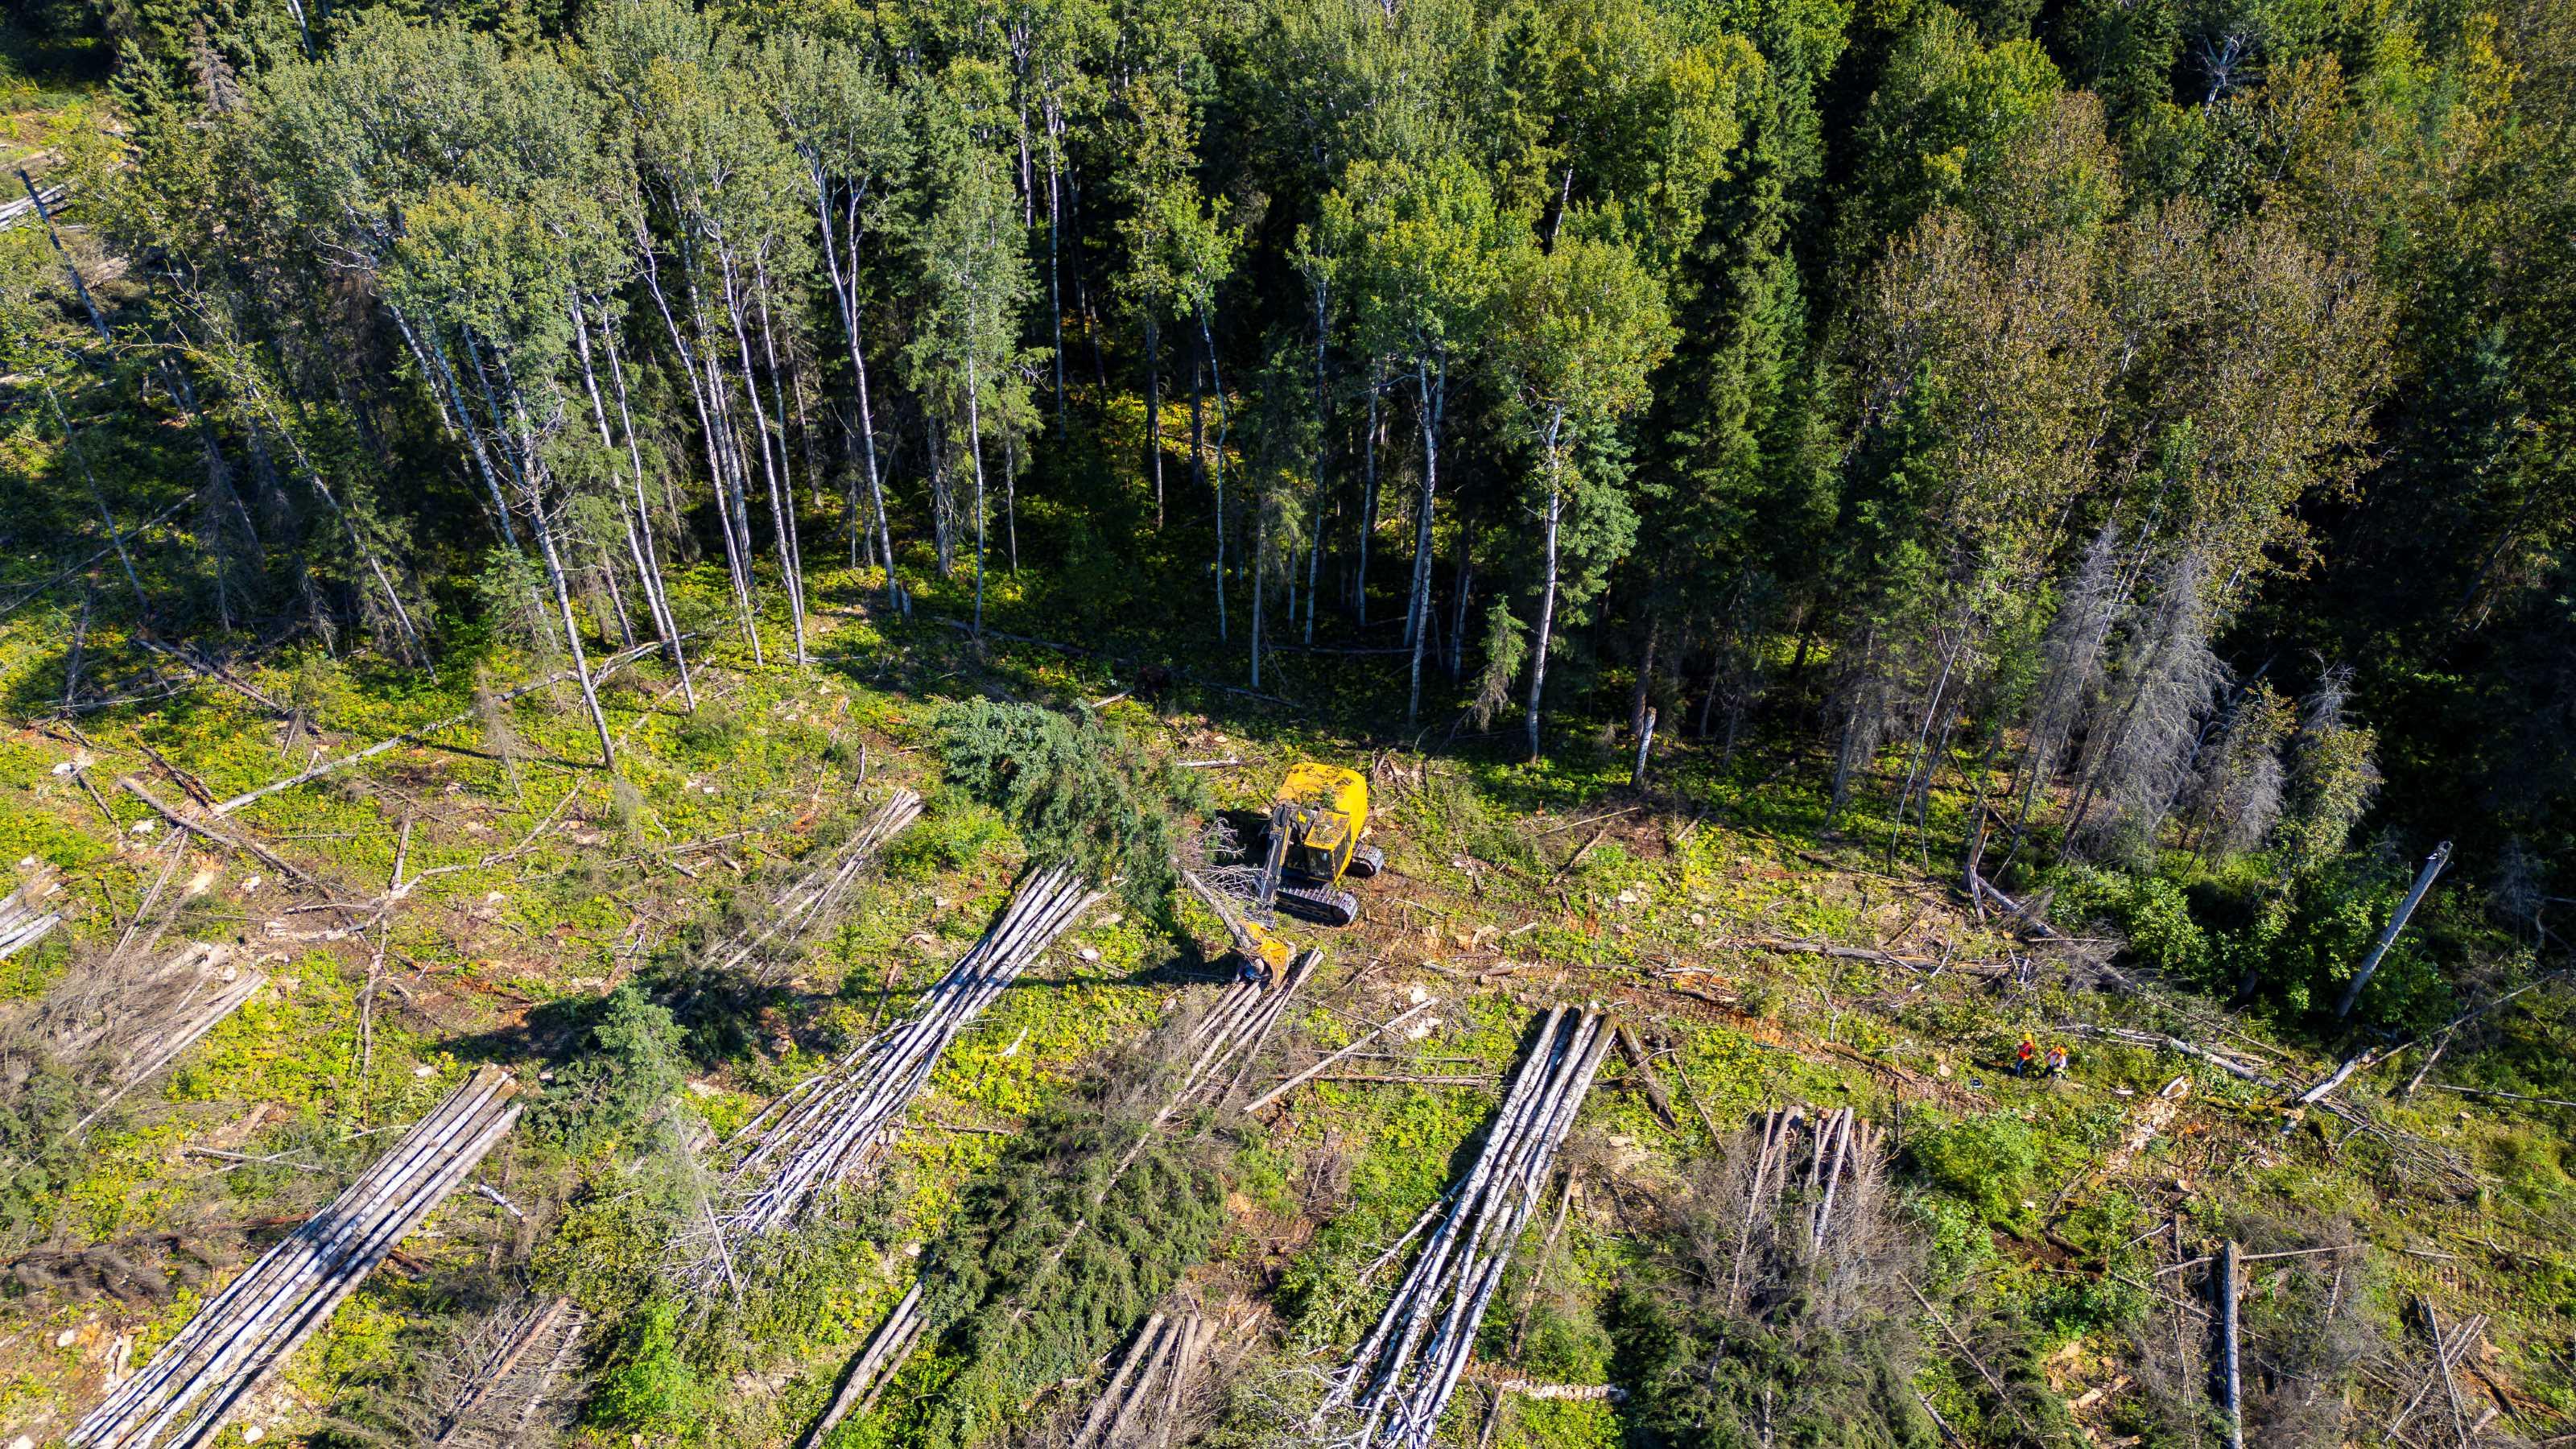
Land uses affect native habitats in different ways. Some cause temporary changes that allow for regrowth (e.g., forest harvesting), while others (e.g., roads, industrial sites) lead to permanent habitat loss.
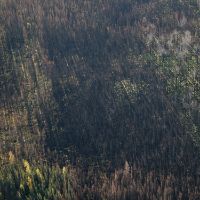
Aging forest stands, whether after fire or forest harvesting, can lead to an increase in old forest area.
Results
Land Base Changes in Vegetation Types
The per cent area of native vegetation disturbed by human footprint and fire between 2010 and 2021 in the Southern Operating Area was:
Detailed Change in All Native Vegetation: 2010 to 2021
- As shown in Sections 2.1 and 2.2, a high annual percentage of area was disturbed by human footprint in White Spruce and mixedwood stands in the Southern Operating Area, with more moderate rates of disturbance in deciduous and pine stands.
- Fire added 4-6% of disturbance in upland stands over the same 11-year time span, including: mixedwood (6%), White Spruce (5%), deciduous (4%), and pine (4%).
- When considering the combined disturbed area of both human footprint and wildfire, area impacted ranged from 10% in pine forest to approximately 20% area disturbed in both White Spruce (20%) and mixedwood (22%) stands between 2010 and 2021. The 20% disturbance over 11 years in White Spruce represents a 55-year disturbance return interval.
- Stands disturbed by fire and forestry provide early seral habitat valued by some species, and those stands will recover towards older-forest conditions over time (results shown in Section 3.3). However, the high disturbance rates when fire is added to forestry will generate a truncated age distribution, making it hard to maintain old forest in the long term.
Detailed Land Base Change
Detailed Land Base Change. For the Southern Operating Area, the top figure shows the total area (km2) of each vegetation type disturbed by fire, non-forestry human footprint (Other Footprint, New), and forestry footprint between 2010 and 2021, as well as the undisturbed area as of 2021. The bottom figure shows the per cent (%) area disturbed by fire, non-forestry human footprint, and forestry human footprint in each vegetation type between 2010 and 2021.
Detailed Change in Old Forest: 2010 to 2021
- A benefit of the land base attribution summaries is that they partition out what is causing changes in old forest. This includes losses from forestry, other human footprint, and fires, along with recruitment as undisturbed stands age across the 120-year cutoff.
- Forestry removed 13–25% of old forest in the four upland stand types between 2010 and 2021, with the highest rates in mixedwood (-25%), while fire removed an additional 7–9%.
- Over the same time, a large area of deciduous forest matured into the >120-year age class, leading to a large percentage (+55%) gain of old deciduous stands in the region.
- Recruitment of old forest was similarly high in mixedwood (+33.0%) stands, but this was almost exactly matched by the losses to forestry (-25.0%) and fire (-8.0%) over that time span, leading to little net change.
- There was a net loss of old conifer stands due to low recruitment of White Spruce and pine into older age classes.
Detailed Land Base Change—Old (>120 years) Forest
Detailed Land Base Change—Old (>120 years) Forest. For the Southern Operating Area, the top figure shows the total area (km2) of old forest by type in 2010 broken into undisturbed area as of 2021, area disturbed by fire, non-forestry human footprint (Other Footprint, New), and forestry footprint between 2010 and 2021, and area recruited into the >120-year-old forest age class between 2010 and 2021. The bottom figure shows the per cent (%) area disturbed by fire, non-forestry footprint, and forestry footprint, and area recruited into the >120-year-old forest age class between 2010 and 2021 in each forest type.
