Effects of Land Base Change on Habitat Suitability
Summary of the effects of land base changes on species' habitat suitability in Tolko's Southern Operating Area.

.jpg)
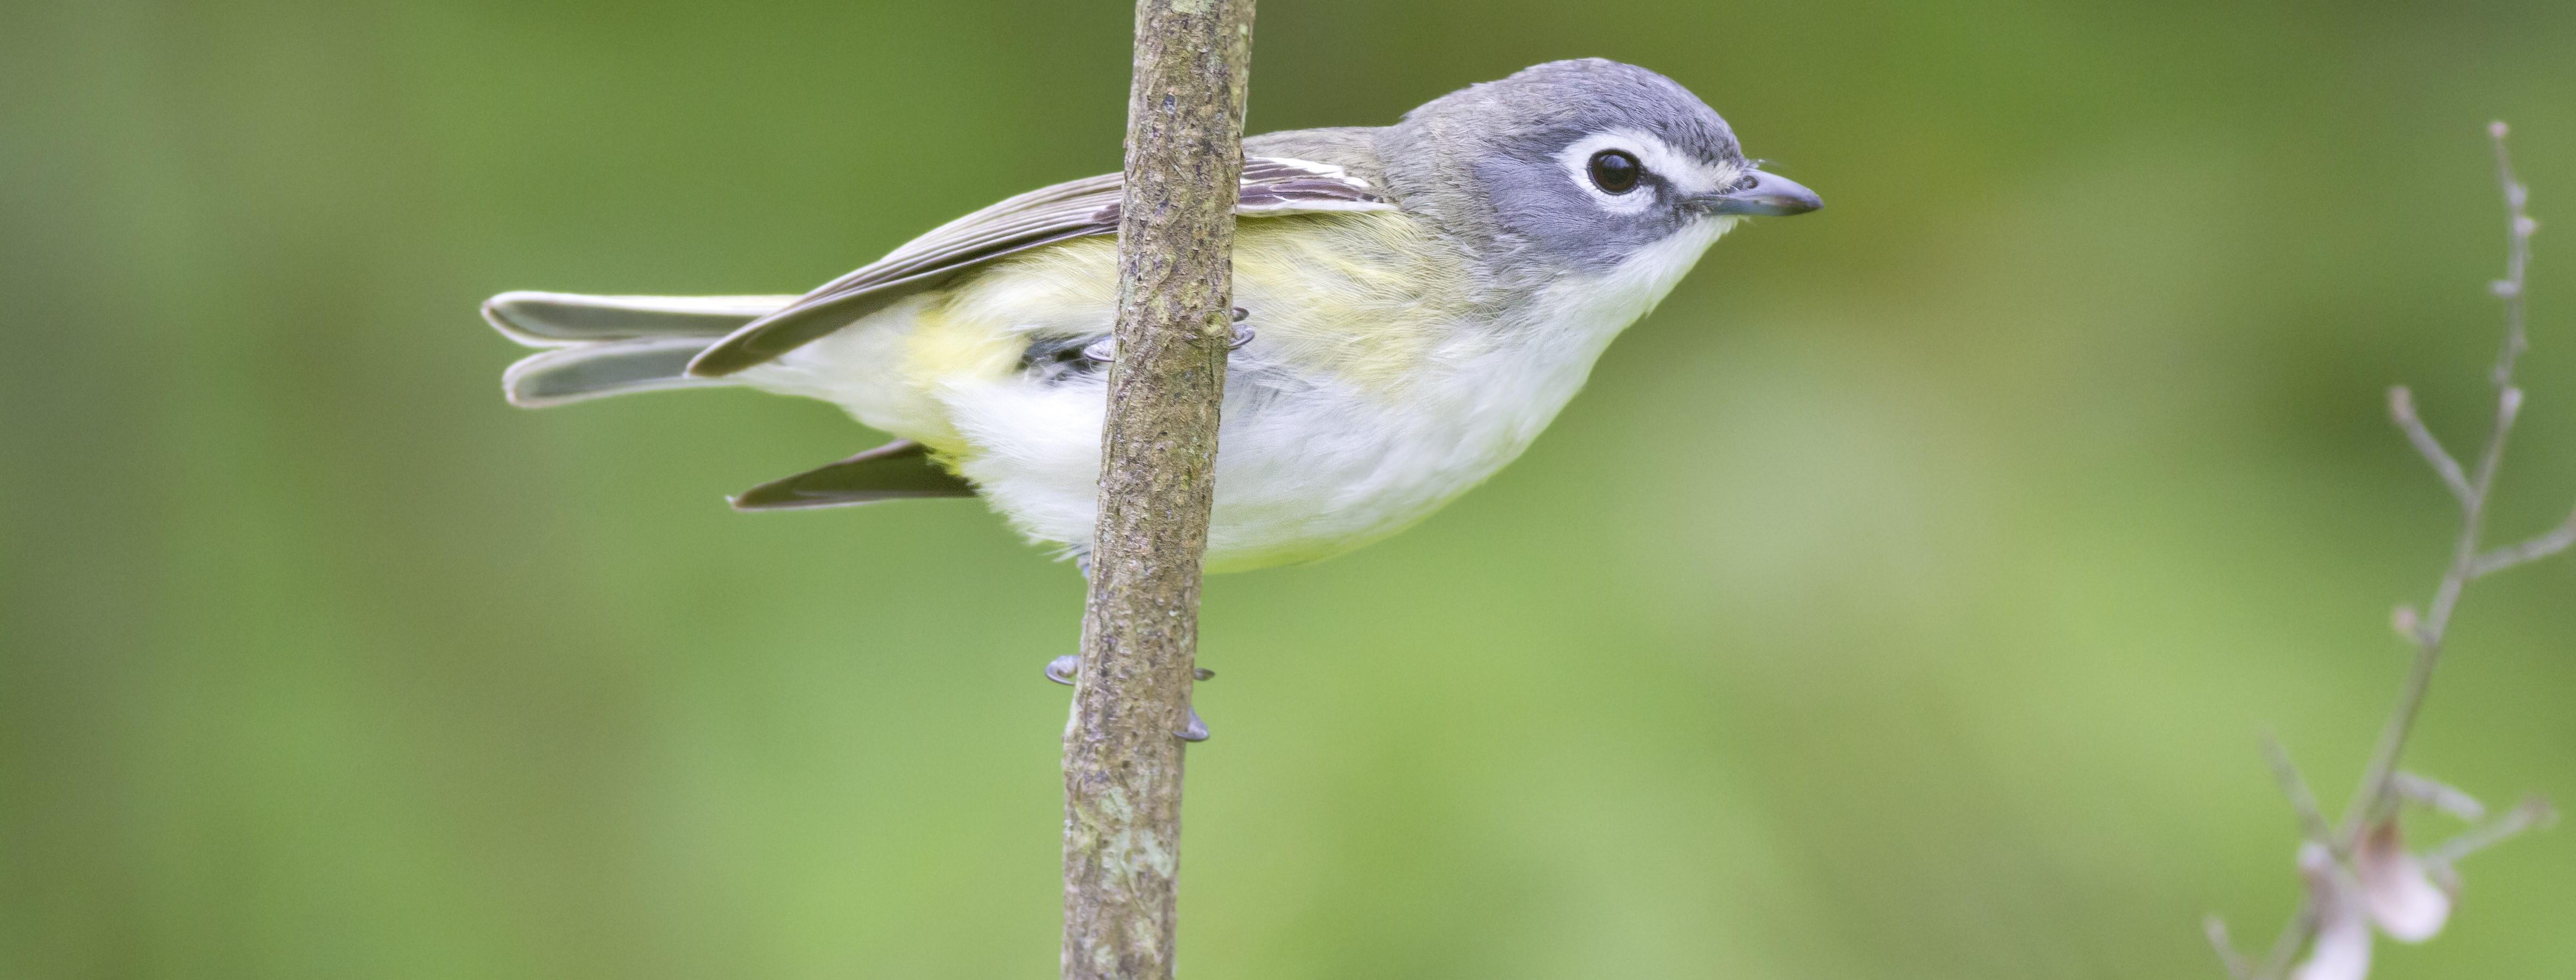
As a mature/old forest specialist that forages on large old White Spruce trees, the Black-throated Green Warbler responds positively to natural aging of forest stands.
- Effects on habitat suitability were assessed for different types of land base change: forestry, non-forestry human footprint, fire, and aging of undisturbed stands.
- The net effect of natural changes was greater than the net effect of human footprint; fire and aging had substantial effects on most taxonomic groups.
- New forestry footprint reduced habitat suitability for 66% of species. This was partially offset by aging of older harvested areas.
Introduction
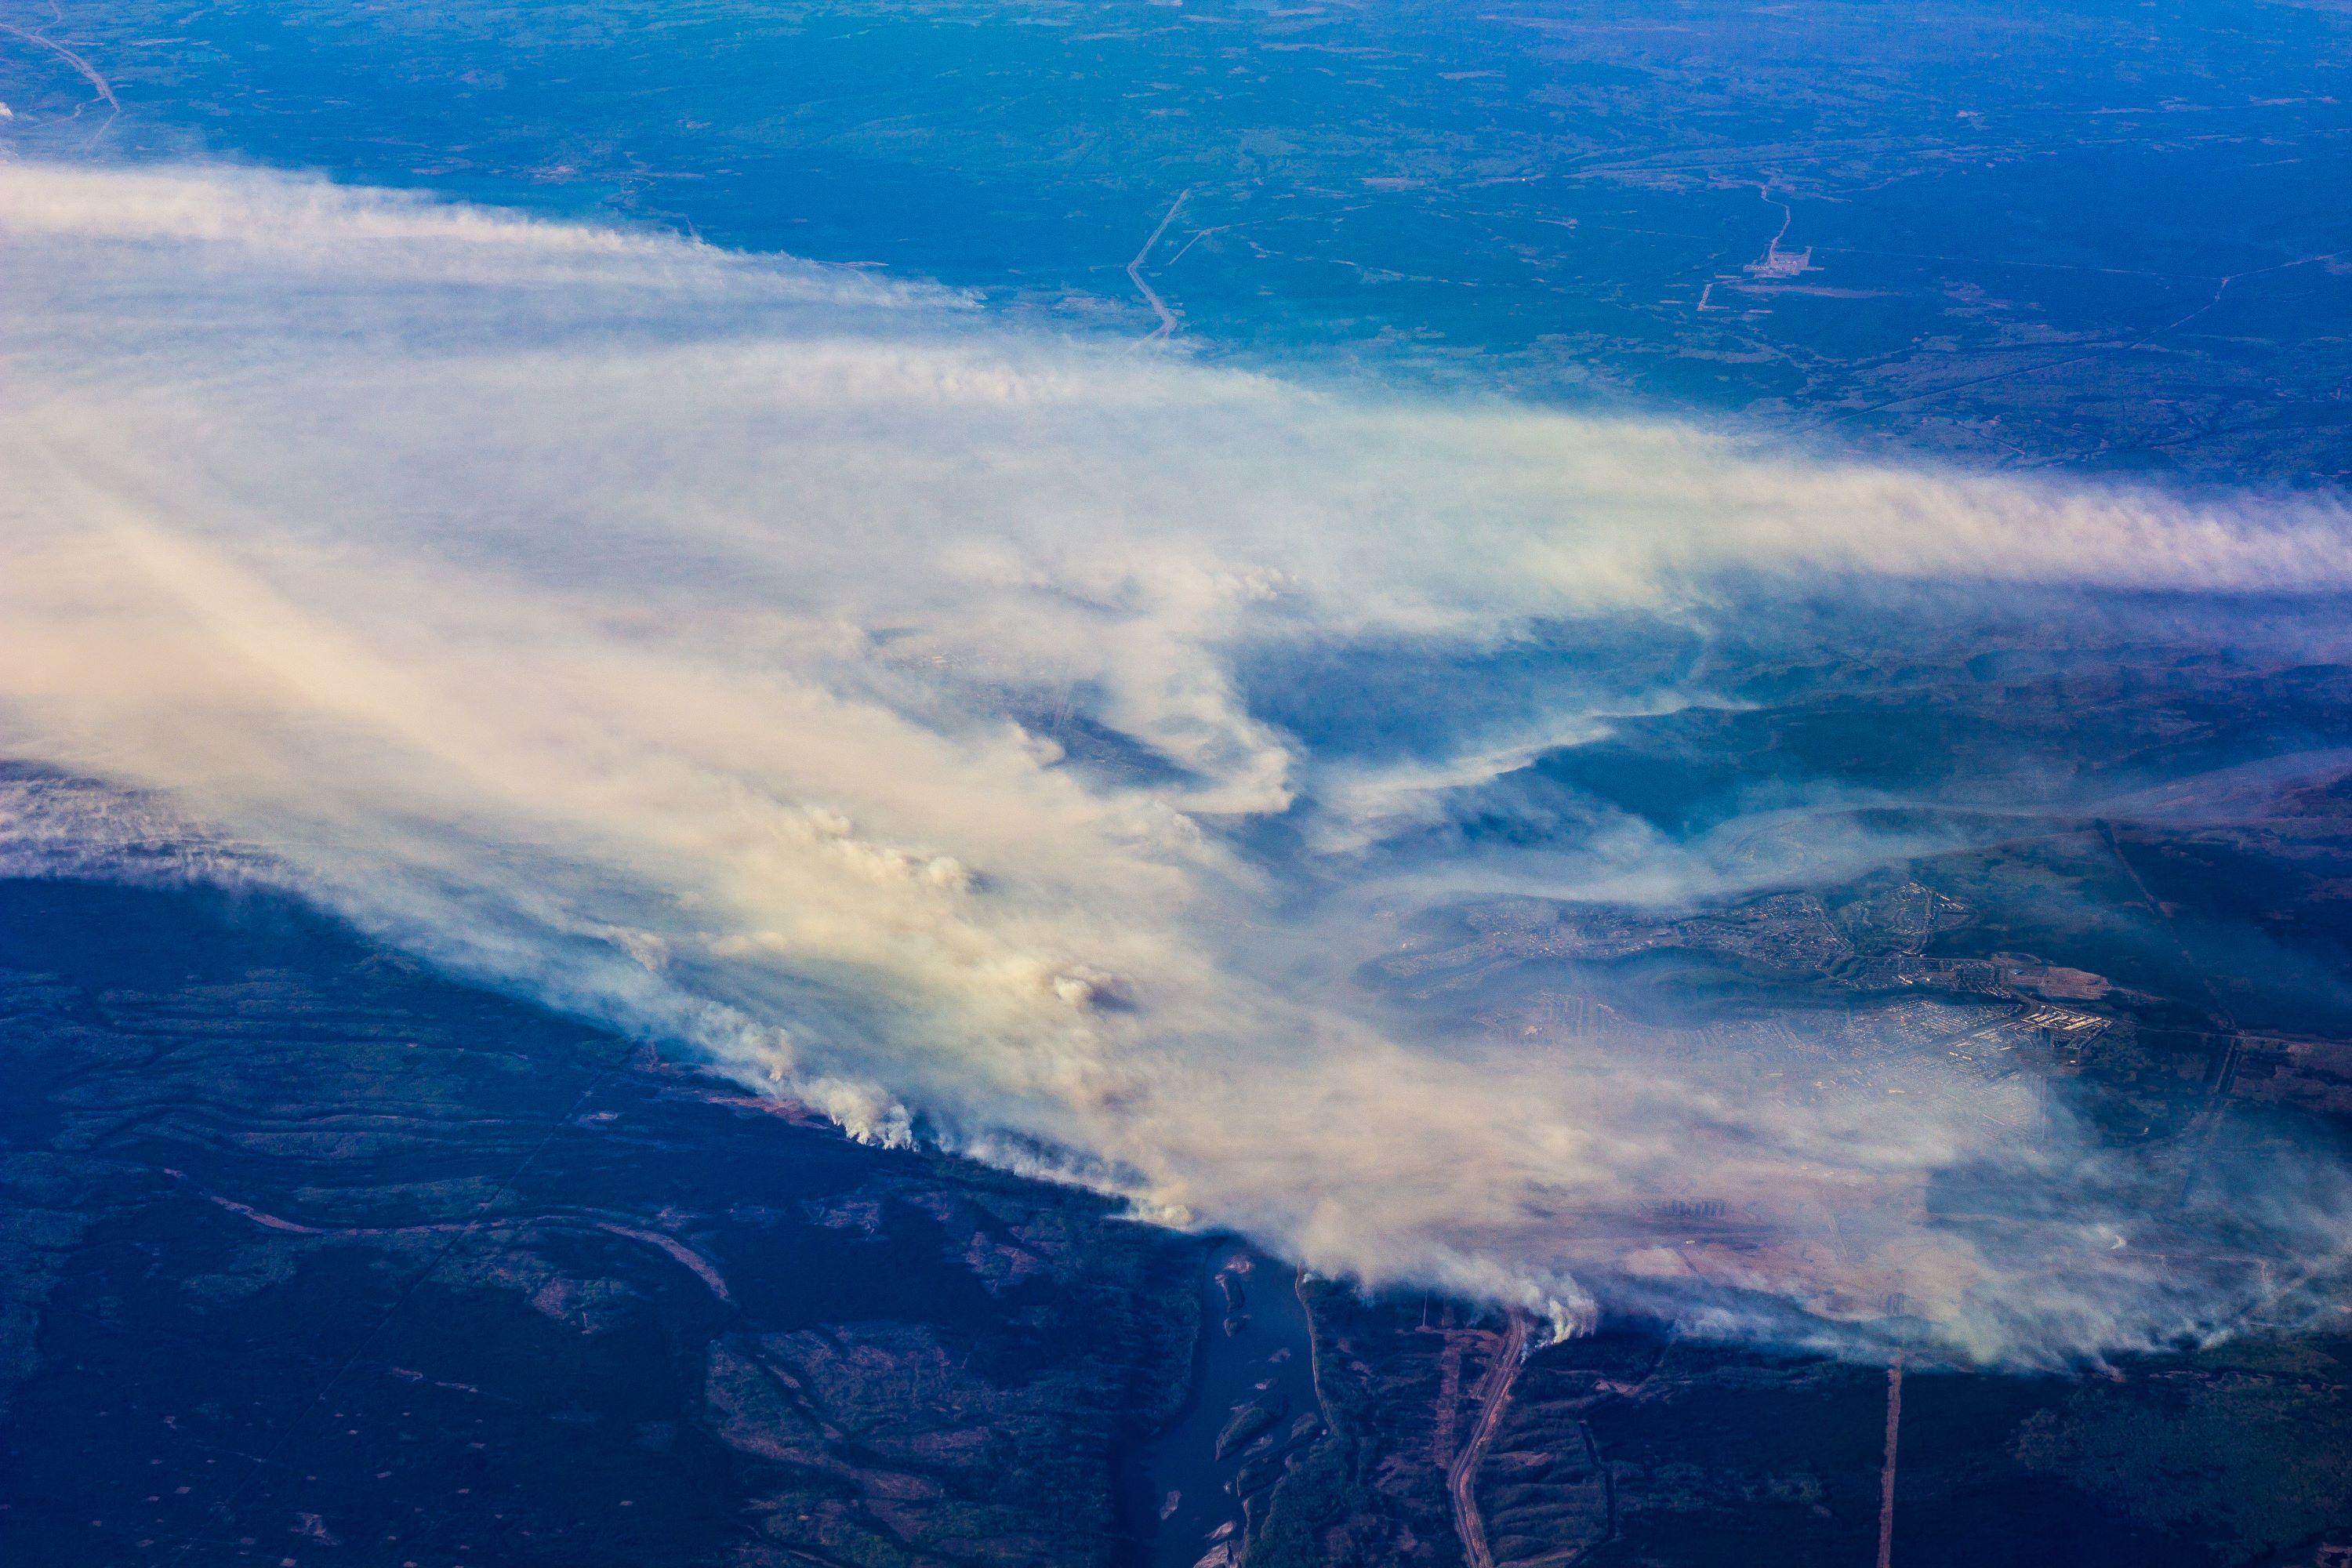
Stand-replacing fires—the predominant natural disturbance in Tolko’s Southern Operating Area—play an important role in maintaining biodiversity in boreal and foothills forests.
Fires create a mosaic of stands of different ages that support a wide range of species, from early seral species to those associated with old forests, helping to increase overall biodiversity in the boreal and foothills forest. Fires are also critical for the persistence of fire-adapted species that depend on these periodic disturbances.
While wildfires are natural events, it is important to consider how fires, alongside human activities such as forestry and other human development activities, are collectively impacting biodiversity in the boreal and foothills forests[1].
In this section, we highlight the effects of different types of land base change from 2010 to 2021 on species’ habitat suitability in Tolko’s Southern Operating Area, including changes as a result of forestry (new and old), non-forestry footprint (new and old), fire, and aging of undisturbed stands.
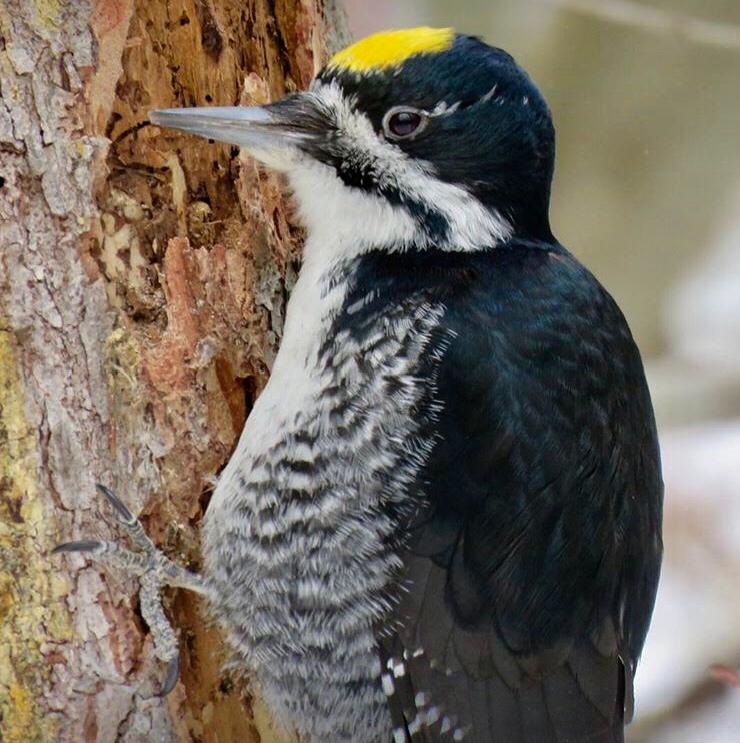
Black-backed woodpecker is a burn specialist—it feeds on wood-boring insects in young burned stands.
Results
Effects of Land Base Changes on Species Habitat
We present overall results for each of six taxonomic groups, showing the distribution of predicted species responses to each type of land base change in the Southern Operating Area between 2010 and 2021. Because 2023 was an exceptional year for wildfires in Alberta[2] (and elsewhere), we also include predicted changes in habitat suitability due to 2023 fires.
In general the results show that:
-
In the Southern Operating Area, the net effect of natural changes on the land base, including fire and aging of naturally disturbed stands, was greater than the net effect of human footprint.
-
Land base changes due to both fire and aging had substantial effects on the habitat suitability for many species in all taxonomic groups except mammals, ranging from from a -17.8% loss in habitat to +83.4% gain in habitat. For birds, soil mites, vascular plants, lichens, and mosses, there were wide distributions of responses for both fire and aging, with species responding both positively and negatively.
-
There is a decrease in habitat suitability for 66% of species as a result of new forestry footprint, though this number is even higher for lichens and mosses. Forestry footprint also improved habitat suitability for many species, particularly for birds and vascular plants; many of these species prefer young forests and therefore benefit from new harvest areas.
-
Aging of older forestry areas tended to partially offset new forestry, with habitat suitability improving for 66% of species, making the distribution of species’ net forestry changes narrower than the new forestry distribution for all taxa.
-
With the exception of vascular plants, the effects of land base changes due to non-forestry human footprint were small (range -1.2 to +3.9 percentage change in habitat suitability) because there were only small areas of non-forestry human footprint added between 2010 and 2021, and there was almost no change in old footprint.
-
When all land base changes are considered together, changes because of human footprint somewhat offset natural changes, so that the distribution of overall net effects was narrower than net natural changes.
Click on a taxonomic group to view results:
Birds
Response of Birds to Land Base Change
The graph below shows the distribution of bird species' responses to each type of land base change in the Southern Operating Area between 2010 and 2021, as well as changes as a result of the 2023 wildfires. Examples of how different species respond to overall land base changes include:
Boreal Chickadee (-6.7%)
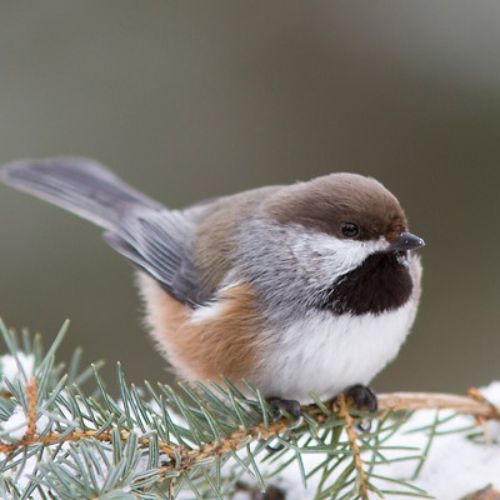
Boreal Chickadee (-6.7% overall net change) nests in cavities in coniferous trees and snags.
Hairy Woodpecker (+17.9%)
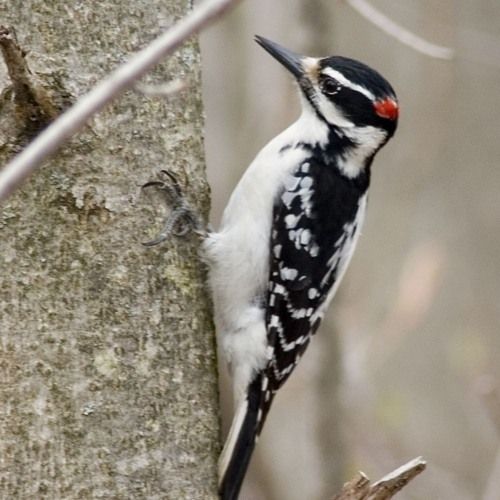
Hairy Woodpecker (+17.9% overall net change) benefitted from the 2023 fires, being common in young forested stands with residual patches of mature trees.
House Wren (+15.2%)
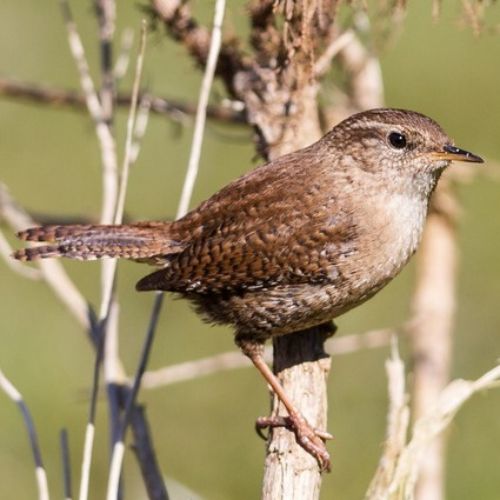
House Wren (+16.7 overall net change) was also predicted to benefit as a prairie species, responding positively to the creation of dry, open burned areas.
The graphs shown below compare the effects of:
- Forestry: New forestry footprint (harvested between 2010 and 2021), regenerating old forestry footprint (harvested before 2010 and continuing to regenerate), and net change.
- Other human footprint: New footprint (created between 2010 and 2021), old footprint (present before 2010), and net change.
- All human footprint combined.
- Natural processes: Fire (areas burned between 2010 and 2021), aging of stands (undisturbed and continued to age between 2010 and 2021), and net change.
- All land base changes combined.
- 2023 Fire: areas burned in 2023. As shown in Section 2.4, fire burned large areas of the Northern Operating Area in 2023, affecting species habitat negatively for some species and positively for others.
Bird Species' Responses to Land Base Changes. Summary of birds in the Southern Operating Area, showing the distribution of each type of land base change for all bird species. Points are species, shaded rectangles are the 5% to 95% quantiles, and black lines are the median.
Bird Highlights
Land Base Change: 2010–2021
- In the Southern Operating Area, habitat suitability improved for 52% of bird species due to new forestry between 2010 and 2021. Most are early seral species, such as the Alder Flycatcher (+17.9% in new forestry footprint), that benefit from new harvest areas more than habitat suitability is reduced in aging older areas.
- Aging of older forestry areas tended to partially offset new forestry, making the distribution of species’ net forestry changes narrower (-9.6% to +3.2%) than the new forestry distribution (-11.7% to +17.9%).
- There were 12 species with at least 5% net loss of habitat due to combined land base changes between 2010 and 2021. These species included the Cape May Warbler (-9.9%) and Bay-breasted Warbler (-10.1%) that prefer old mixedwood and White Spruce forests, and are negatively affected by both new forestry and fire changes on the land base.
- There were a few species with at least a 10% increase in habitat suitability overall. This included species that rely on recent fires for habitat, such as the Black-backed Woodpecker (+33.8%), as well as species that prefer open habitats for nesting and foraging, such as the Song Sparrow (+14.2%).
Wildfire 2023
- Because the 2023 wildfires burned in all habitat types and across age classes, there were no bird species that showed disproportionate habitat loss.
- The species predicted to have the greatest loss of habitat due to 2023 fires are species that rely on mature/old forest habitat, such as Golden-crowned Kinglet (-8.7%), Cape May Warbler (-8.4%), and Bay-breasted Warbler (-7.9%).
- Species that benefit from recent burns showed large percentage increases in habitat; the 2023 fires may have compensated for effective fire suppression in recent decades. Increaser species included Hairy Woodpecker (+28.3%) and the fire-specialist Black-backed Woodpecker (+31.0%), which forages on bark- and wood-boring beetles that increase in abundance following burns.
Effects of Land Base Change on Individual Bird Species
To view the effects of land base change on individual bird species, use the search bar to find a species or select your species of interest from the dropdown menu. Once you click on a species in the dropdown menu, the land base change graph will appear below.
Mammals
Response of Mammals to Land Base Change
The graph below shows the distribution of mammal species' responses to each type of land base change in the Southern Operating Area between 2010 and 2021, as well as changes as a result of the 2023 wildfires. Examples of how different species respond to overall land base changes include:
Fisher (-0.8%)
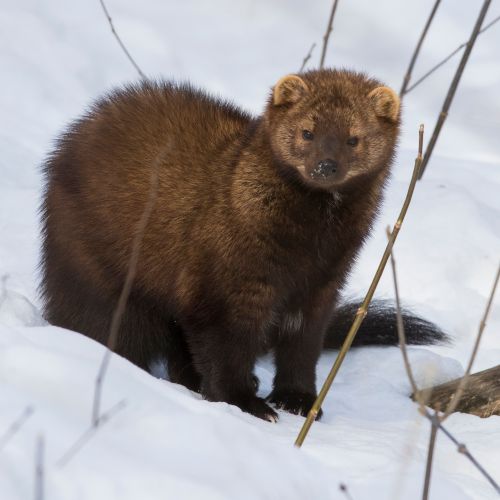
Fisher (-0.8% overall net change) is associated with old forest, and responds negatively to forest harvest and other human activities.
Gray Wolf (+1.6%)
_Canis%20lupus.jpg)
Gray Wolf (+1.6% overall net change) is adaptable to a variety of habitats, so long as prey species are available and the habitat is isolated from people.
Striped Skunk (+3.0%)
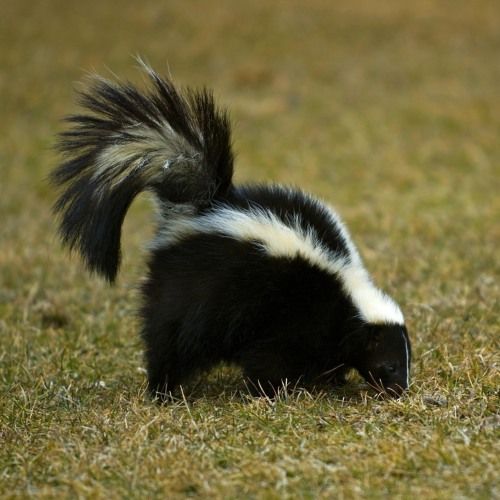
Striped Skunk (3.0% overall net change) is an adaptable species that is typically associated with open habitats.
The graphs shown below compare the effects of:
- Forestry: New forestry footprint (harvested between 2010 and 2021), regenerating old forestry footprint (harvested before 2010 and continuing to regenerate), and net change.
- Other human footprint: New footprint (created between 2010 and 2021), old footprint (present before 2010), and net change.
- All human footprint combined.
- Natural processes: Fire (areas burned between 2010 and 2021), aging of stands (undisturbed and continued to age between 2010 and 2021), and net change.
- All land base changes combined.
- 2023 Fire: areas burned in 2023. As shown in Section 2.4, fire burned large areas of the Northern Operating Area in 2023, affecting species habitat negatively for some species and positively for others.
Mammal Species' Responses to Land Base Changes. Distribution of mammal species’ responses to each type of land base change, summarized as the per cent change in habitat suitability in the Southern Operating Area. Points are species, shaded rectangles are the 5% to 95% quantiles, and black lines are the medians.
Mammal Highlights
Land Base Change: 2010–2021
-
In the Southern Operating Area, mammal species’ responses were generally small for all types of land base changes combined, ranging from -1.1% to +3.0%, with the exception of Elk (+7.7%). Elk had a strong positive response to natural aging of forested landscapes.
-
Most large mammals detected with wildlife cameras are habitat generalists that can use a wide range of habitats and/or are more responsive to changes in the availability of prey.
Wildfire 2023
-
For mammals, there was limited change in habitat suitability due to the 2023 wildfires in the Southern Operating Area, ranging from a -6.6% loss in habitat for Elk to a +2.3% gain for Canada Lynx at the regional scale.
-
Fires were not concentrated in particular habitat types or age classes in Tolko’s Southern Operating area, but rather impacts were distributed across the land base. Most mammal species have wide ranges that extend beyond the impacted areas, with suitable habitat available elsewhere in the operating area.
Effects of Land Base Change on Individual Mammal Species
To view the effects of land base change on individual mammal species, use the search bar to find a species or select your species of interest from the dropdown menu. Once you click on a species in the dropdown menu, the land base change graph will appear below.
Soil Mites
Response of Soil Mites to Land Base Change
The graph below shows the distribution of soil mite species' responses to each type of land base change in the Southern Operating Area between 2010 and 2021, as well as changes as a result of the 2023 wildfires. Examples of how different species respond to overall land base changes include:
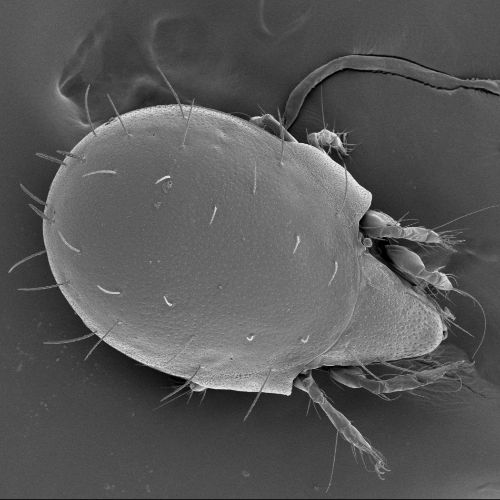
Malaconothrus mollisetosus (-11.1%)

Malaconothrus mollisetosus (-11.1% overall net change) is associated with mossy, wet forested habitats.
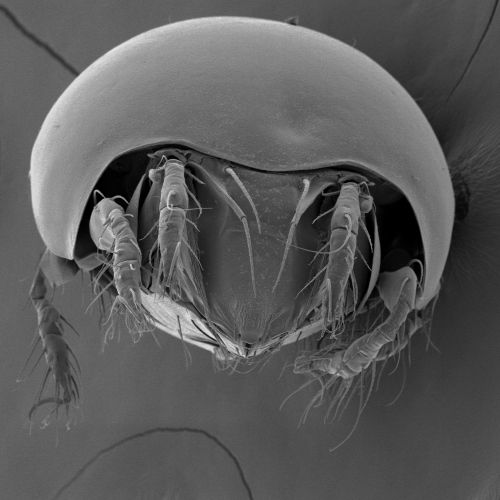
Peloribates sp. 3 DEW (-10.4%)
Peloribates sp. 3 DEW (-10.4% overall net change) is commonly associated with upland forest habitats.
Zetomimus francisi (+8.6%)
Zetomimus francisi (+8.6% overall net change) is associated with young forest stands.
The graphs shown below compare the effects of:
- Forestry: New forestry footprint (harvested between 2010 and 2021), regenerating old forestry footprint (harvested before 2010 and continuing to regenerate), and net change.
- Other human footprint: New footprint (created between 2010 and 2021), old footprint (present before 2010), and net change.
- All human footprint combined.
- Natural processes: Fire (areas burned between 2010 and 2021), aging of stands (undisturbed and continued to age between 2010 and 2021), and net change.
- All land base changes combined.
- 2023 Fire: areas burned in 2023. As shown in Section 2.4, fire burned large areas of the Northern Operating Area in 2023, affecting species habitat negatively for some species and positively for others.
Soil Mite Species' Responses to Land Base Changes. Distribution of soil mite species’ responses to each type of land base change, summarized as the per cent change in habitat suitability in the Southern Operating Area. Points are species, shaded rectangles are the 5% to 95% quantiles, and black lines are the medians.
Soil Mite Highlights
Land Base Change: 2010–2021
- In Tolko’s Southern Operating Area, habitat suitability decreased for 66% of soil mite species due to new forestry between 2010 and 2021; this was partially offset by an increase in habitat suitability for these species in aging forests. Forest harvest can decrease the availability and diversity of leaf litter, which decreases the availability and composition of food for soil mites[2].
- Habitat suitability declined by at least 10% for three species as a result of combined land base changes. All three species (Neoribates sp. 1 DEW, Malaconothrus mollisetosus, Peloribates sp. 3 DEW) are associated with young to mid-age forests and were responding negatively to aging of natural stands.
- The species with the largest increases in overall habitat suitability had stronger responses to natural land base changes than to changes due to forestry or other human footprint. Camisia sp. 1 DEW (+14.5%), Zetomimus francisi (+13.9%) and Scutozetes lanceolatus (+10.0%) all responded most strongly to native aging.
Wildfire 2023
-
The species predicted to have the greatest loss of habitat as a result of the 2023 fires in the Southern Operating Area are species that are associated with mature/old forest habitat, such as Epidamaeus sp. 5 DEW (-11.6%).
-
Other species benefited from recent burns, and showed increases in habitat, with four species showing at least a 10% gain in habitat. These include Scutozetes lanceolatus (+17.0%), which is associated with young, naturally disturbed forests, and Camisia sp. 1 DEW (+14.0%), which is associated with young, naturally disturbed mixedwood stands as well as shrub habitats in northern Alberta.
Effects of Land Base Change on Individual Soil Mite Species
To view the effects of land base change on individual soil mite species, use the search bar to find a species or select your species of interest from the dropdown menu. Once you click on a species in the dropdown menu, the land base change graph will appear below.
Vascular Plants
Response of Vascular Plants to Land Base Change
The graph below shows the distribution of vascular plant species' responses to each type of land base change in the Southern Operating Area between 2010 and 2021, as well as changes as a result of the 2023 wildfires. Examples of how different species respond to overall land base changes include:
Blue Columbine (-15.4%)
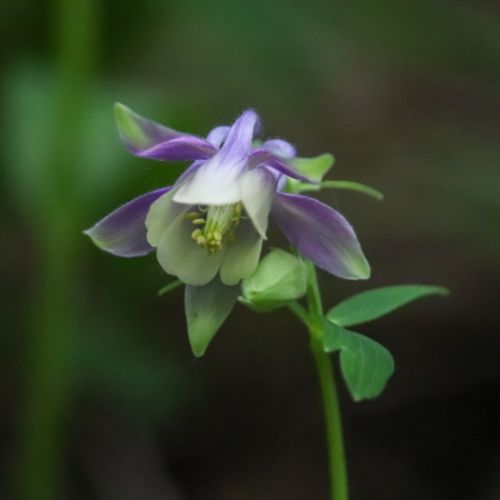
Blue Columbine (-15.4% overall net change) prefers moist habitats found in mature/old coniferous forests and riparian areas.
Pale Coralroot (-6.5%)
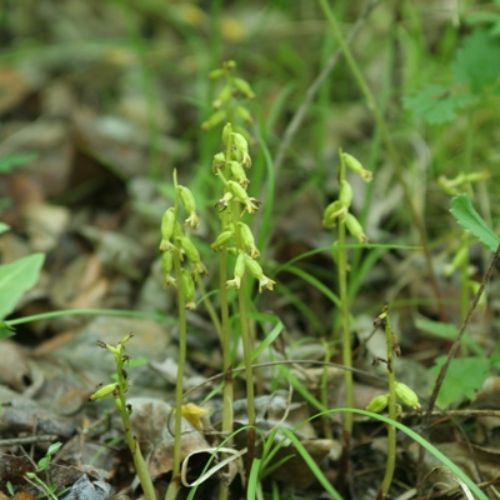
Pale Coralroot (-6.5% overall net change) is a sensitive forest species that grows in moist, dark environments found in mature/old forests.
Bicknell’s Geranium (+22.8%)
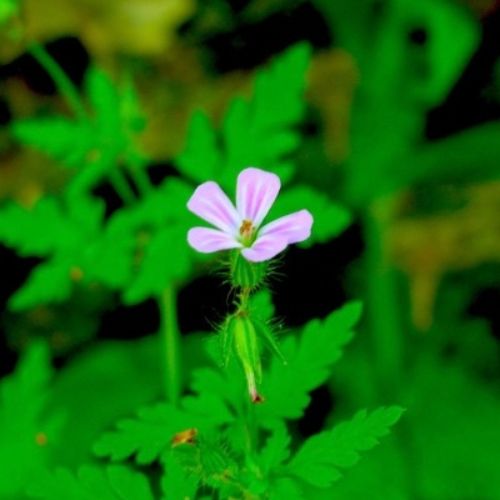
Bicknell’s Geranium (+22.8% overall net change) responds positively to disturbance by both forestry and fire.
The graphs shown below compare the effects of:
- Forestry: New forestry footprint (harvested between 2010 and 2021), regenerating old forestry footprint (harvested before 2010 and continuing to regenerate), and net change.
- Other human footprint: New footprint (created between 2010 and 2021), old footprint (present before 2010), and net change.
- All human footprint combined.
- Natural processes: Fire (areas burned between 2010 and 2021), aging of stands (undisturbed and continued to age between 2010 and 2021), and net change.
- All land base changes combined.
- 2023 Fire: areas burned in 2023. As shown in Section 2.4, fire burned large areas of the Northern Operating Area in 2023, affecting species habitat negatively for some species and positively for others.
Vascular Plant Species' Responses to Land Base Changes. Distribution of vascular plant species’ responses to each type of land base change, summarized as the per cent change in habitat suitability in the Southern Operating Area. Points are species, shaded rectangles are the 5% to 95% quantiles, and black lines are the medians.
Vascular Plant Highlights
Land Base Change: 2010–2021
- In the Southern Operating Area, 66% of vascular plant species showed a net decrease due to forestry. Most of these species, such as Clasping Leaved Twisted Stalk (-9.6%), are associated with the shade and moisture provided by mature and old forests. However, there were several species that had gains of at least 5%, with six species gaining more than 10% as a result of new forestry footprint. Many vascular plants are adapted to the open, sunny conditions found in disturbed areas.
- Habitat suitability declined by more than 10% for one species as a result of all land base changes combined between 2010 and 2021: Blue Columbine (-15.4%) had strong negative responses to fire and new forestry.
- There were 11 species with habitat gains of more than 10% as a result of all land base changes combined. Most of these species prefer early seral habitat, as evidenced by their negative response to aging of habitats and forested areas. For example, Northern Willowherb (+20.5%) is common in forest openings and disturbed areas.
Wildfire 2023
-
The species predicted to have the greatest loss of habitat as a result of the 2023 fires in the Southern Operating Area are species that rely on mature/old forest habitat. For example, the top decreaser species—False Solomon’s Seal (-11.5%), Clasping Leaved Twisted Stalk (-11.4%) and Blue Columbine (-10.4%)—all thrive in moist, shaded habitats.
-
There were 14 species with habitat gains of more than 10% as a result of the 2023 fires. Bicknell’s Geranium (+56.5%) and Pink Corydalis (+39.4%) are both associated with disturbed habitats, particularly those that have been burned.
Effects of Land Base Change on Individual Vascular Plant Species
To view the effects of land base change on individual vascular plant species, use the search bar to find a species or select your species of interest from the dropdown menu. Once you click on a species in the dropdown menu, the land base change graph will appear below.
Mosses
Response of Mosses to Land Base Change
The graph below shows the distribution of moss species' responses to each type of land base change in the Southern Operating Area between 2010 and 2021, as well as changes as a result of the 2023 wildfires. Examples of how different species respond to overall land base changes include:
Red Beard Moss (-10.9%)
Red Beard Moss (-10.9% overall net change) is associated with older White Spruce and pine stands, and negatively associated with forest harvest and other human activities.
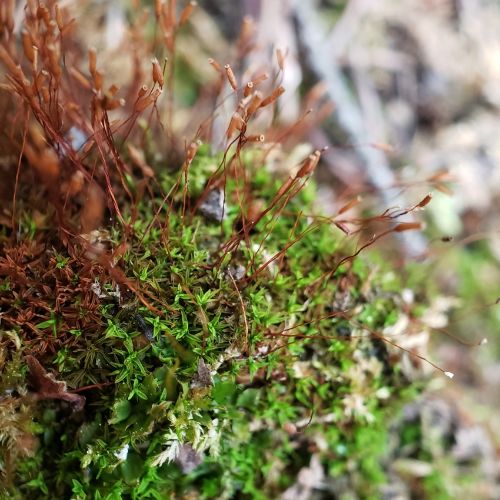
Red-mouthed Leafy Moss (-5.7%)
.jpg)
Red-mouthed Leafy Moss (-5.7% overall net change) grows on rotten logs and moist soil or humus—habitat attributes that are found in older forests.
Juniper Haircap Moss (+7.8%)
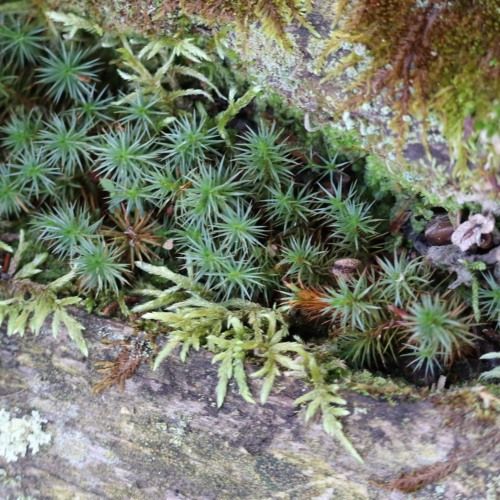
Juniper Haircap Moss (+7.8% overall net change) is a common species that is associated with younger forest stands.
The graphs shown below compare the effects of:
- Forestry: New forestry footprint (harvested between 2010 and 2021), regenerating old forestry footprint (harvested before 2010 and continuing to regenerate), and net change.
- Other human footprint: New footprint (created between 2010 and 2021), old footprint (present before 2010), and net change.
- All human footprint combined.
- Natural processes: Fire (areas burned between 2010 and 2021), aging of stands (undisturbed and continued to age between 2010 and 2021), and net change.
- All land base changes combined.
- 2023 Fire: areas burned in 2023. As shown in Section 2.4, fire burned large areas of the Northern Operating Area in 2023, affecting species habitat negatively for some species and positively for others.
Moss Species' Responses to Land Base Changes. Summary of mosses in the Southern Operating Area, showing the distribution of each type of land base change for all moss species. Points are species, shaded rectangles are the 5% to 95% quantiles, and black lines are the median.
Moss Highlights
Land Base Change: 2010–2021
- In the Southern Operating Area, habitat suitability declined for 65% of moss species due to new forestry. Most moss species rely on the cool, moist habitat provided by mature and old forests, and respond negatively to canopy removal.
- When all land base changes are considered together, the species with the largest increases in habitat suitability—Umbrella Liverwort (+18.8%) and Golden Thread-moss (+10.6%)—had strong positive responses to fire.
- Moss species in general benefit from the aging of forests, whether the stands originated from forestry or fire.
Wildfire 2023
-
74% of moss species lost habitat in Tolko’s Southern Operating Area as a result of the 2023 wildfires in the region.
-
The species predicted to have the greatest habitat loss are species that rely on mature/old forest habitat. For example, Mueller’s Pouchwort (-9.6%) grows on rotten logs and moist soil—habitat attributes that are found in older forests.
-
Other species benefited from recent burns, including three species that had habitat gains of at least 10%: Umbrella Liverwort (+25.9%), Golden Thread-moss (+13.1%), and Bonfire Moss (+10.8%).
Effects of Land Base Change on Individual Moss Species
To view the effects of land base change on individual moss species, use the search bar to find a species or select your species of interest from the dropdown menu. Once you click on a species in the dropdown menu, the land base change graph will appear below.
Lichens
Response of Lichens to Land Base Change
The graph below shows the distribution of lichen species' responses to each type of land base change in the Southern Operating Area between 2010 and 2021, as well as changes as a result of the 2023 wildfires. Examples of how different species respond to overall land base changes include:
Fan Ramalina (-10.5%)
Fan Ramalina (-10.5% overall net change) typically grows on the trunks of large deciduous trees and large shrubs.
Variable Wrinkle Lichen (-8.6%)
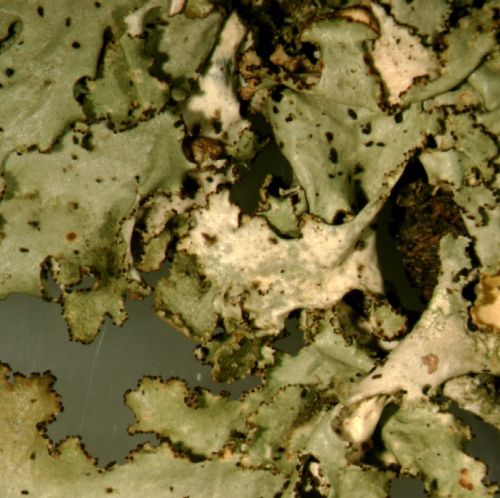
Variable Wrinkle Lichen (-8.6% overall net change) is associated with mature/old forest stands in the boreal forest.
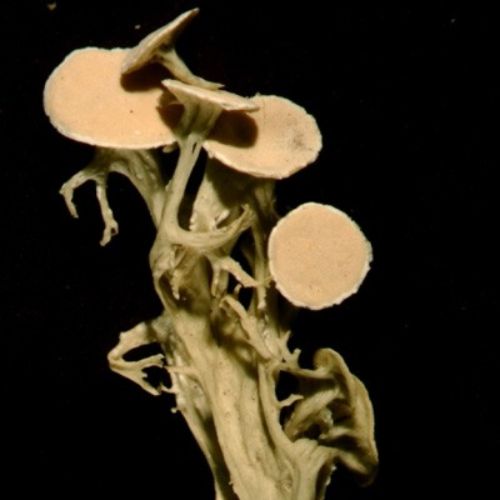
Peltigera didactyla group (+19.6%)
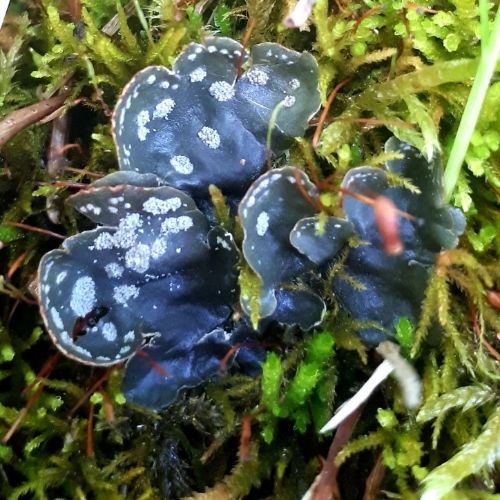
Peltigera didactyla group (+19.6% overall net change), which grows on mineral soils, is associated with young forests, including recently harvested stands, and decreases in abundance with stand age.
The graphs shown below compare the effects of:
- Forestry: New forestry footprint (harvested between 2010 and 2021), regenerating old forestry footprint (harvested before 2010 and continuing to regenerate), and net change.
- Other human footprint: New footprint (created between 2010 and 2021), old footprint (present before 2010), and net change.
- All human footprint combined.
- Natural processes: Fire (areas burned between 2010 and 2021), aging of stands (undisturbed and continued to age between 2010 and 2021), and net change.
- All land base changes combined.
- 2023 Fire: areas burned in 2023. As shown in Section 2.4, fire burned large areas of the Northern Operating Area in 2023, affecting species habitat negatively for some species and positively for others.
Lichen Species' Responses to Land Base Changes. Summary of lichens in the Southern Operating Area, showing the distribution of each type of change for all lichen species. Points are species, shaded rectangles are the 5% to 95% quantiles, and black lines are the median.
Lichen Highlights
Land Base Change: 2010–2021
- Habitat suitability was reduced for the majority (83%) of lichen species in the Southern Operating area as a result of both new forestry and fires between 2010 and 2021. Natural aging of forest stands originating from wildfires compensated for the new fires; similarly, aging of harvest areas compensated for new forestry.
- The net result of all land base changes was that habitat suitability declined moderately for many species, and more severely for a few species. Many of these species are most abundant in older forests and have specific habitat requirements that are mainly found in mature/old forests.
- There are four lichen species with >10% increase in habitat due to combined land base changes. These species—for example, Laddered Pixie-cup (Cladonia verticillata; +10.4%)—tend to be pioneer species (species that colonize new or recently disturbed environments).
Wildfire 2023
- Because many lichens depend on trees as substrates to grow (trunk, bark, branches), as well as the microclimatic conditions in closed canopy forests, the land base changes due to the 2023 fire were predicted to result in loss of habitat for 85% of lichen species. Some species predicted to have the greatest loss of habitat in the Southern Operating Area were indeed lichens that grow on trees, including Angel’s Hair (-10.7%).
- Habitat suitability was improved for only 15% of lichen species as a result of the 2023 wildfires. The three lichen species with habitat gains of at least 5% due to wildfires in 2023 were: Field Dog-lichen (Peltigera rufescens/wulingensis/papuana; +9.9%), Laddered Pixie-cup (Cladonia verticillata; +16.4%), and the Peltigera didactyla grp (+21.9%).
Effects of Land Base Change on Individual Lichen Species
To view the effects of land base change on individual lichen species, use the search bar to find a species or select your species of interest from the dropdown menu. Once you click on a species in the dropdown menu, the land base change graph will appear below.
Caveats
Caveats
- These changes reflect the predicted changes in species’ habitat suitability due to changes in the land base that we can map. Many other factors can also change species’ populations. We will be able to look into those when we have direct trend information, which we can then compare to the changes predicted from land base change.
- These predicted effects of land base change are based on the period 2010–2021. Harvest rates, and particularly fires, vary over time. The ABMI will soon have province-wide mapping for the year 2000, so that we can extend the attribution analysis over a longer time period.
- The results are based on ABMI habitat models, which are imperfect and improve over time as we collect more data.
References
Best, I.N., L. Brown, C. Elkin, et al. 2024. Cut vs. fire: a comparative study of the temporal effects of timber harvest and wildfire on ecological indicators of the boreal forest. Landscape Ecology 39: 81. https://doi.org/10.1007/s10980-024-01882-4
Huggard, D., B. Allen, and D.R. Roberts. 2024. Effects of 2023 wildfires in Alberta. ABMI Science Letters Issue 8: March, 2024. Available at: https://abmi.ca/publication/642
Meehan, M.L., Z. Song, L.M. Lumley, T.P. Cobb and H. Proctor. 2019. Soil mites as bioindicators of disturbance in the boreal forest in northern Alberta, Canada: testing taxonomic sufficiency at multiple taxonomic levels. Ecological Indicators 102: 349-365.
