Native Habitat: Status and Trend
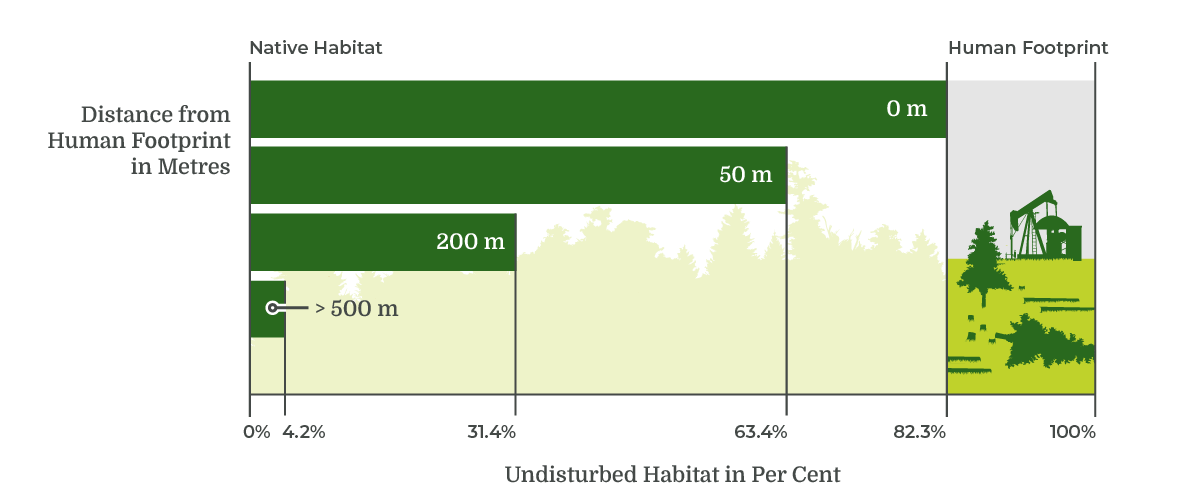
Summary of the status (circa 2021) and trend (2010–2021) of native habitat in Tolko's Southern Operating Area, including interior native habitat at 50 m, 200 m, and 500 m away from human footprint.

Native Habitat
- Interior native habitat was 63.4%, 31.4%, and 4.2% at 50 m, 200 m and 500 m away from human footprint respectively.
- The distribution of linear footprint is the primary factor reducing the area of interior habitat.
- 6.5% of native habitat was converted to human footprint between 2010 and 2021. White Spruce and mixedwood stands were the vegetation types most impacted by human footprint in this time frame, resulting in more edge habitat and less interior habitat compared to other vegetation types.
Per cent human footprint and per cent native habitat at four buffer distances from human footprint.
Introduction
Undisturbed natural areas, or native habitats, are important to maintain biodiversity and ecosystem functions[1]. Habitat loss due to human disturbance is a primary threat to biological diversity[2].
- In addition to the direct loss of native habitat, proximity of human footprint can change environmental conditions in nearby native habitat, known as edge effects, indirectly impacting biodiversity.
- Some wildlife species, such as the Dark-eyed Junco and Chipping Sparrow, can use habitat that is adjacent to human footprint[3]. Other species prefer habitat that is more distant from human footprint, Woodland Caribou being the most well-known example.
- Most measured ecological edge effects have effective distances <50 m from human footprint, with a few extending 200 m or more. The distance of 500 m is generally well away from any edge effects, although there are still some broader regional effects of footprint, such as introduction of non-native species, altered fire regimes, and access for hunting.
- Within its Southern Operating Area, Tolko has established a target that the area of old interior forest in harvest year 10 (2031) will not decrease by more than 10%. Tolko will be within 80% of this goal by adhering to the spatial harvest sequence[4].
Status and trend of native habitat and interior native habitat at three distances (i.e., 50 m, 200 m, 500 m) from human footprint is summarized for Tolko’s Southern Operating Area.
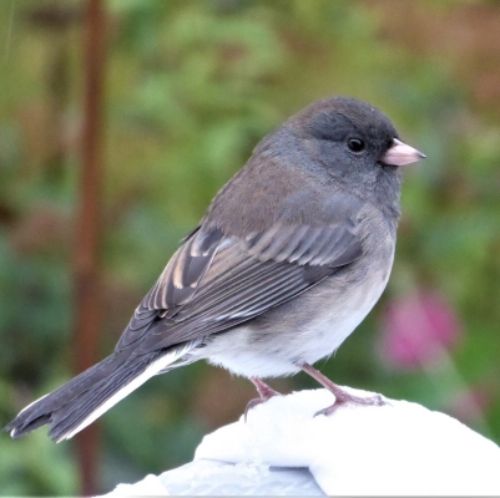
Dark-eyed Junco can tolerate some habitat alteration.
_Rangifer%20tarandus%20(2)_3862x2415_432x432.jpg)
Woodland Caribou is associated with undisturbed coniferous forests and peatlands.
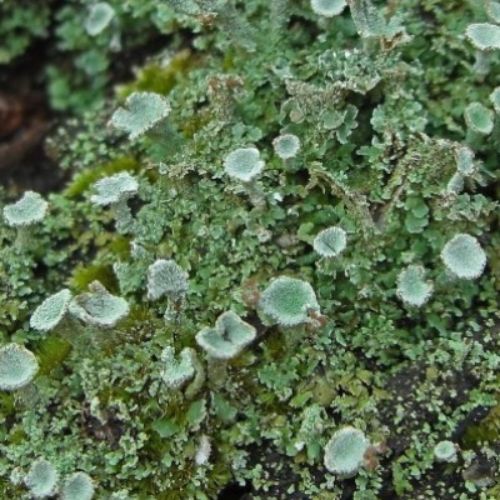
Many lichens, such as Gray's Pixie-cup, are sensitive to disturbance.
Results
Status of Native Habitat
The status of native habitat (circa 2021) at increasing distances from human footprint in the Southern Operating Area was:
0 buffer
50-m buffer
200-m buffer
500-m buffer
Highlights
- Native habitat (circa 2021) covers 82.3% of the Southern Operating Area.
- While more than 60% of the Southern Operating Area is composed of native habitat at least 50 m away from human footprint, this decreases to 31.4% at least 200 m from human footprint. Only 4.2% of interior native habitat is at least 500 m from human footprint.
- Human development activities occur throughout the Southern Operating Area. It is the distribution of this footprint, especially linear footprint, throughout the landscape that contributes to the fragmentation of native vegetation, reducing the area of interior native habitat.
Change in the Area of Interior Native Habitat: 2010–2021
- The Southern Operating Area had very little native vegetation >500 m from human footprint: 5.0% in 2010, declining to 4.2% in 2021. Native vegetation >200 m from human footprint declined from 37.4% to 31.4% over that time span.
- As shown in Section 2.2, White Spruce and mixedwood stands were the vegetation types most impacted by human footprint from 2010 to 2021, but all upland stand types lost substantial amounts of interior habitat over that time.
Change in Interior Native Habitat
Change in Interior Native Habitat. For the Southern Operating Area, the change in the area of interior native habitat from 2010 to 2021, expressed as a percentage of the total area of undisturbed vegetation in 2010, measured at four distances from human footprint: 0–50 m (lightest green), 50–200 m, 200–500 m, and >500 m (darkest green). Hover over each segment of the bar for a summary of: 1) the percentage of native vegetation area at the selected distance from human footprint, and 2) the percentage of native vegetation within each distance category (i.e., 0–50 m, 50–200 m, 200–500 m, and >500 m).
References
Potapov, P., M.C. Hansen, L. Laestadius, S. Turubanova, A. Yaroshenko, C. Thies, W. Smith, I. Zhuravleva, A. Komarova, S. Minnemeyer, and E. Esipova. 2017. The last frontiers of wilderness: tracking loss of intact forest landscapes from 2000 to 2013. Science Advances 3(1):e1600821.
Sanderson, E.W., M. Jaiteh, M.A. Levy, K.H. Redford, A.V. Wannebo, and G. Wolmer. 2002. The human footprint and the last of the wild. Bioscience 52(10):891-904.
Bayne, E., H. Lankau, and J. Tigner. 2011. Ecologically-based criteria to assess the impact and recovery of seismic lines: the importance of width, regeneration, and seismic density. Report No. 192. Edmonton, AB. 98 pp.
Tolko Industries Ltd., Vanderwell Contractors (1971) Ltd., and West Fraser Mills Ltd. 2021. Lesser Slave Lake regional forest management plan. Prepared by FORCORP Solutions Inc.
